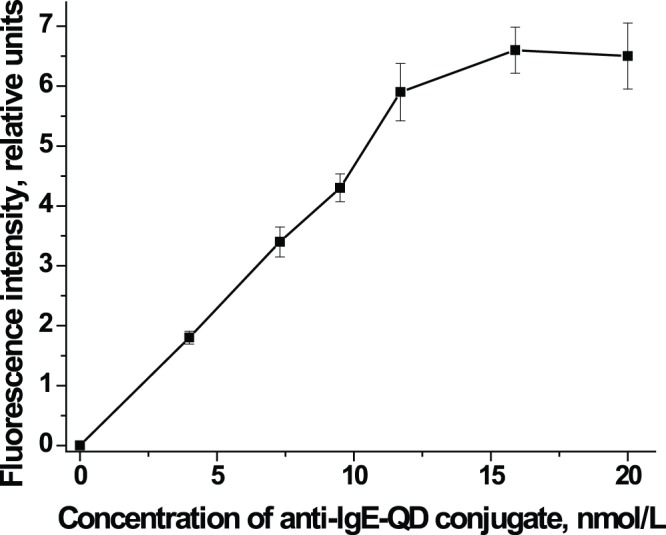
Figure 1. Selecting the optimal concentration of anti-IgE-QD.

The figure shows the relationship between fluorescence intensity in the test zone of the immunochromatographic assay and the concentration of anti-IgE-QD conjugate. A standard solution of IgE with a concentration of 200 kU/L was used as a sample.
