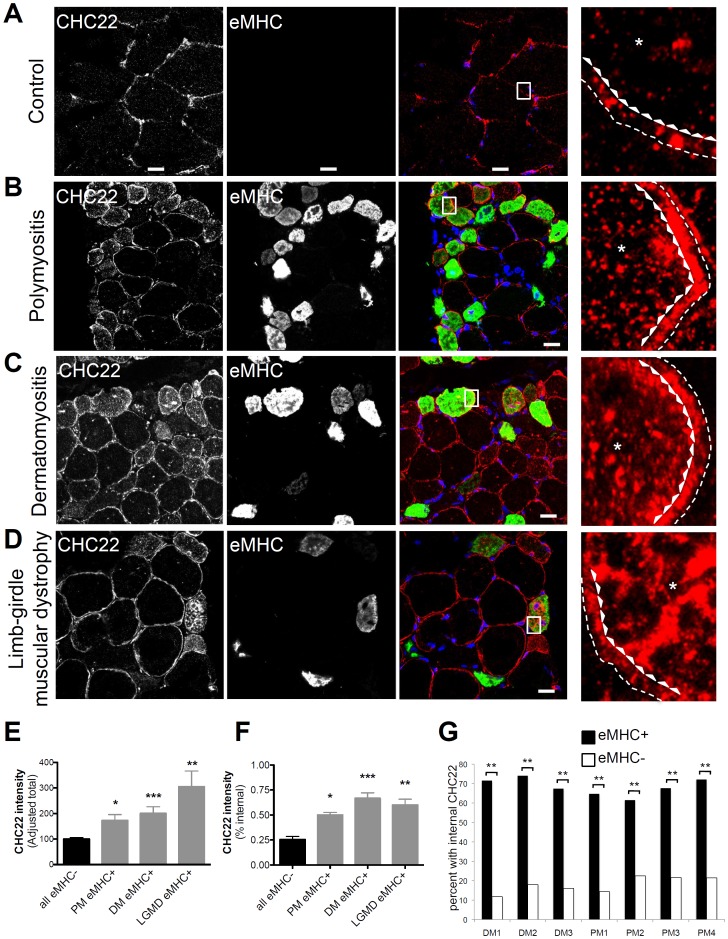
Figure 1. Increased internal CHC22 in regenerating muscle fibers in several human myopathies.
A, B, C and D) Transverse sections of human skeletal muscle from a control individual or patients with polymyositis (PM), dermatomyositis (DM) or limb girdle muscular dystrophy (LGMD) were immunostained with polyclonal antibody against CHC22 (red) and a monoclonal antibody against embryonic myosin heavy chain (eMHC, green). Black and white images for each antibody are shown. In the merged color images nuclei were stained with DAPI (blue) and red-green overlap is shown in yellow (scale bars, 20 µm). The boxed regions in the merged images are magnified seven-fold at the far right and show CHC22 staining only. To illustrate the way in which internal fiber staining was quantified, the fiber boundaries drawn are shown in the magnified boxed regions with the thin dashed line representing the fiber border and the line of arrowheads representing the boundary for quantifying internal staining with the arrowheads pointing to the fiber interior. Only a segment of the fiber quantified is shown, but the asterisks in the internal region highlight the increased internal staining in the eMHC-positive fibers compared to the control. E) Quantification of total CHC22 fluorescence intensity (adjusted for patient comparison, see methods) in eMHC-negative (eMHC−) fibers (n = 40) from all patients and eMHC-positive (eMHC+) fibers from patients with PM (n = 17), DM (n = 14) or LGMD (n = 5) in the patients shown in A–D, where n is the number of fibers analyzed for each patient. All patients had statistically significant higher CHC22 fluorescence intensity in eMHC+ fibers (solid grey bars) compared to eMHC− fibers (solid black bar), as determined by one-way ANOVA (*p<0.05, **p<0.01, ***p<0.001). F) Quantification of internal CHC22 (internal pixel values/total pixel values with internal staining cut-off 2.5 microns beneath the fiber border, as illustrated in A–D in eMHC-negative (eMHC−) fibers (n = 19) from all patients and eMHC−positive (eMHC+) fibers from patients with PM (n = 8), DM (n = 4) or LGMD (n = 3) in the patients shown in A–D, where n is the number of fibers analyzed for each patient. Internal CHC22 fluorescence was significantly higher in eMHC+ fibers from patients with PM, DM and LGMD as determined by one-way ANOVA (*p<0.05, **p<0.01, ***p<0.001). G) The frequency of muscle fibers with internal CHC22 labeling was determined for fibers that were eMHC+ with central nuclei or eMHC− fibers in muscle sections from patients with PM (n = 4) and DM (n = 3), immunostained as in A, where n is the number of patients analyzed. All patients analyzed had a statistically significant higher frequency of internal CHC22 in eMHC+ fibers (solid bars) than in eMHC− fibers (open bars) (**p<0.01), as determined by Fisher’s exact test.

