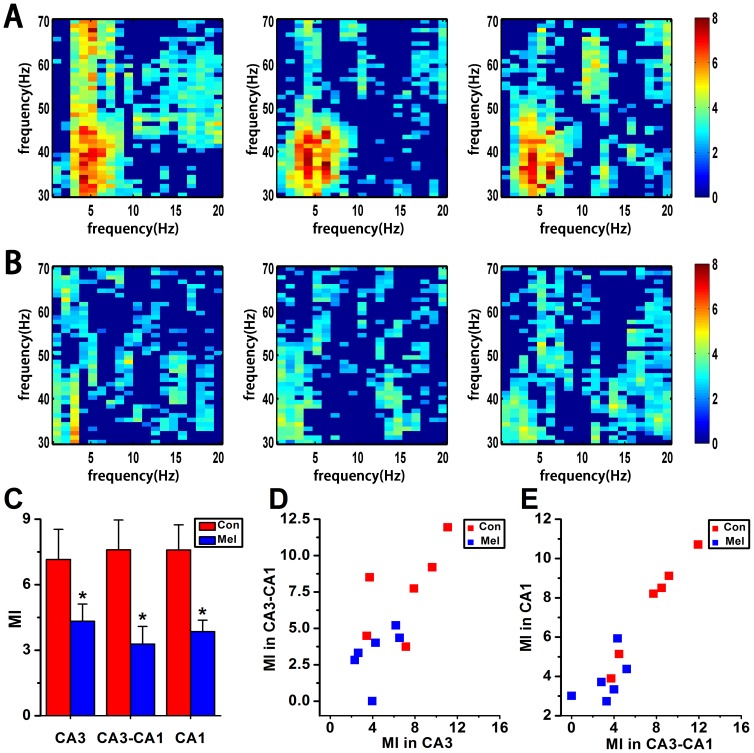
Figure 4. MI analysis in CA3-CA1 network in Con and Mel groups.
A & B. The modulation index as a function of analytic amplitude (30 to 70 Hz) and phase (1 to 20 Hz) in CA3, CA3-CA1 and CA1 in both Con and Mel groups. The higher MI value the stronger cross frequency coupling. C. Statistical MI data of phase-amplitude coupling between theta and gamma rhythms in hippocampal CA3-CA1 network. *P<0.05 for comparison between Con group and Mel group. D. Scatter plot of CA3 MI data vs. CA3-CA1 MI data for all normal and melamine-treated rats. E. Scatter plot of CA3-CA1 MI data vs. CA1 MI data for all normal and melamine-treated rats.

