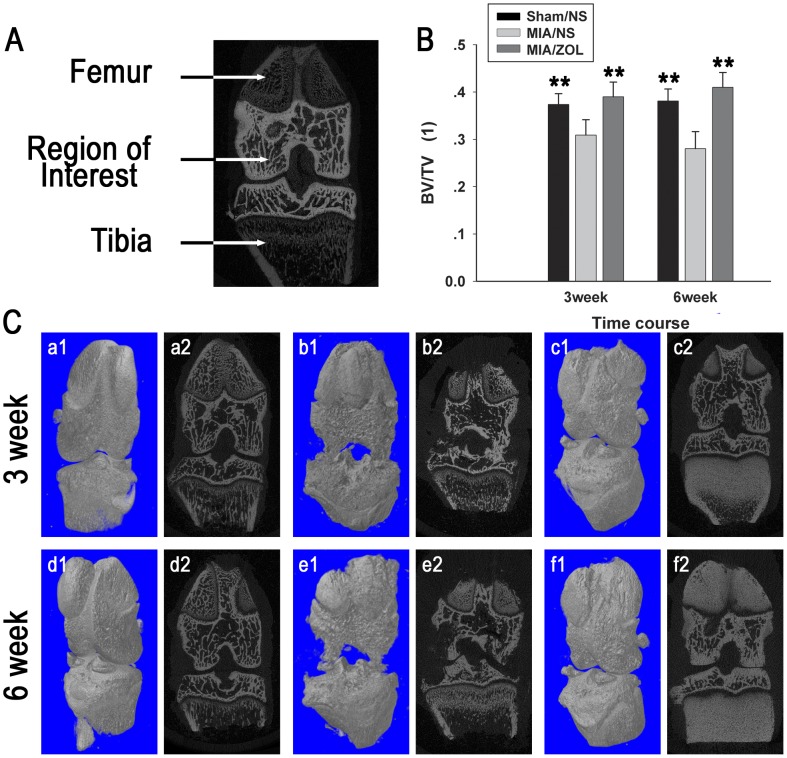
Figure 1. Alterations in subchondral bone architecture on micro-CT scans.
A, Regions between the distal growth plate of the femur and the proximate growth plate of the tibia were selected as regions of interest. B, Analysis of bone volume fraction (BV/TV). Asterisks (**) denote P<0.01 compared to the MIA/NS group. C, Representative micro-CT images of the knee. Sham/NS group: a1, a2, d1, d2; MIA/NS group: b1, b2, e1, e2; MIA/ZOL group: c1, c2, f1, f2.

