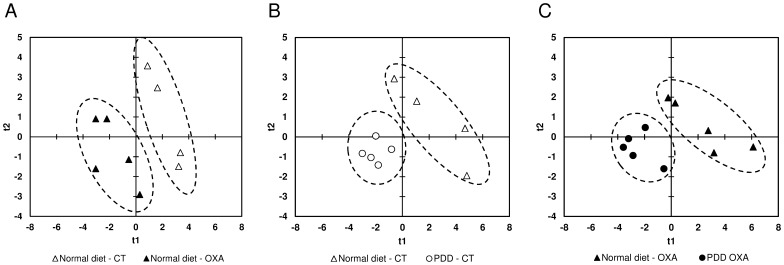
Figure 3. Score plots of PLS-DA analysis based on the 18 metabolites of the spinal dorsal horn quantified from 1H-NMR data.
PLS-DA analysis revealed a clear separation of the metabolic phenotypes of spinal samples between control rats fed with a normal diet (normal diet - CT) and oxaliplatin-treated rats fed with a normal diet (normal diet - OXA) (A), control rats fed with a normal diet (normal diet – CT) and control rats fed with a PDD (PDD - CT) (B) and oxaliplatin-treated rats fed with a normal diet (normal diet - OXA) and oxaliplatin-treated rats fed with a PDD (PDD - OXA) (C) 3 days after oxaliplatin injection. Each point represents an individual sample. Ellipses have been drawn to encompass samples from the same treatment group (n = 4 to 5 per group).

