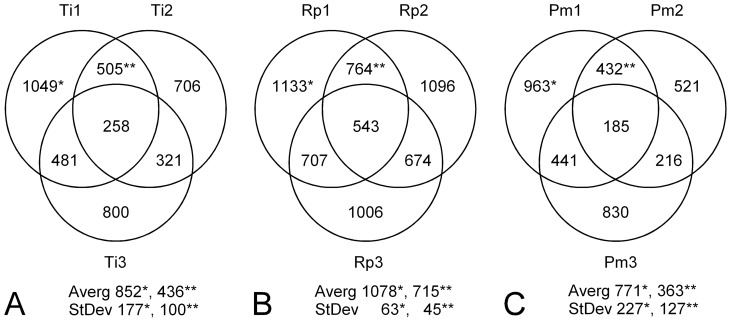
Figure 2. Distribution of metabolites among triatomines.
Venn diagrams represent metabolite frequencies (numbers in circles) and their share among replicates (circles) for each triatomine species (A: T. infestans or Ti, B: R. prolixus or Rp, C: P. megistus or Pm). For example, the sample size of replicate number 1 of T. infestans (Ti1) is n = 1,049; it shares 505 metabolites in common with Ti2 and 481 with Ti3. 258 metabolites are common among the three replicates. (*) is for the average number and standard deviation of sample size among triplicates and (**) is for those parameters concerning common metabolites between replicate pairs.

