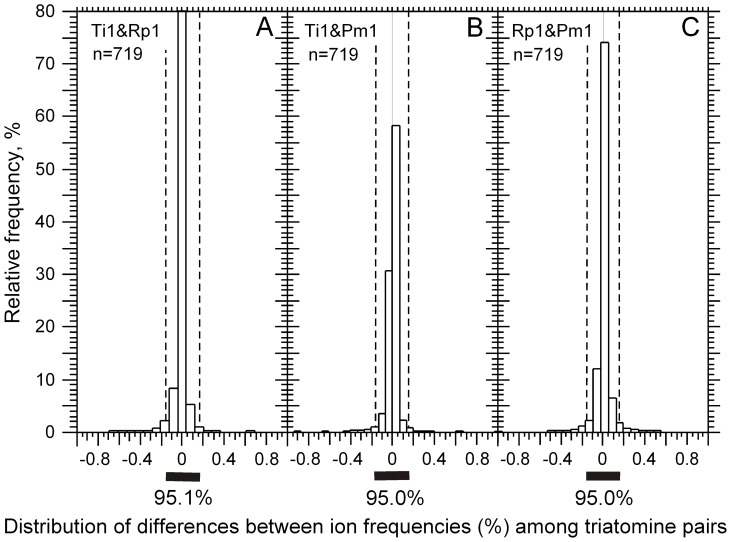
Figure 4. Distributions of metabolite rate differences.
Three examples are given for the distributions of these differences among feces of different triatomine species, i.e., T. infestans vs. R. prolixus (A), T. infestans vs. P. megistus (B) and R. prolixus vs. P. megistus (C). The histograms focus on the significant part of the samples in terms of representativeness, but the values were found in a larger interval. In all panels, ∼95% of pair differences are found between −0.15 and +0.15 (n = 2,086).

