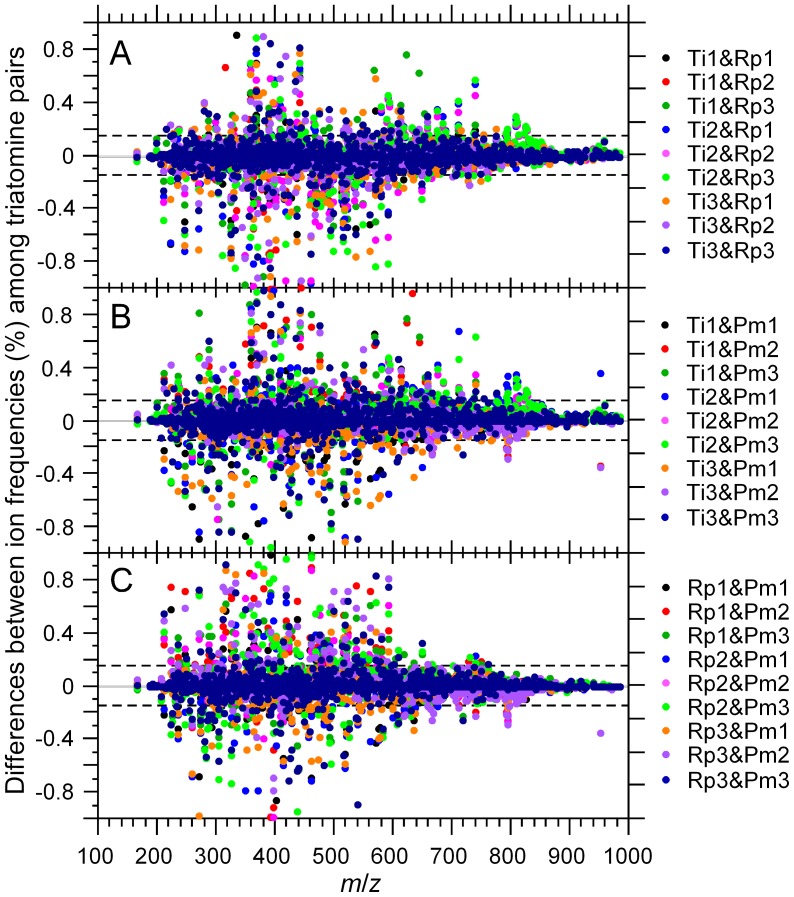
Figure 5. Differences in ion frequencies among triatomine replicates.
Plots are given for all replicate combinations considering the following triatomine pairs: T. infestans vs. R. prolixus (A), T. infestans vs. P. megistus (B) and R. prolixus vs. P. megistus (C). Dots between dashed lines are for the metabolites with small differences among pairs of triatomine species. Dots outside the dashed lines are for the metabolites displaying large differences among pairs of triatomine species (at p≤0.05). For plotting convenience, the scale of the y axis has been limited to the interval −1 to +1. Some pairs exist outside this range (data not shown).

