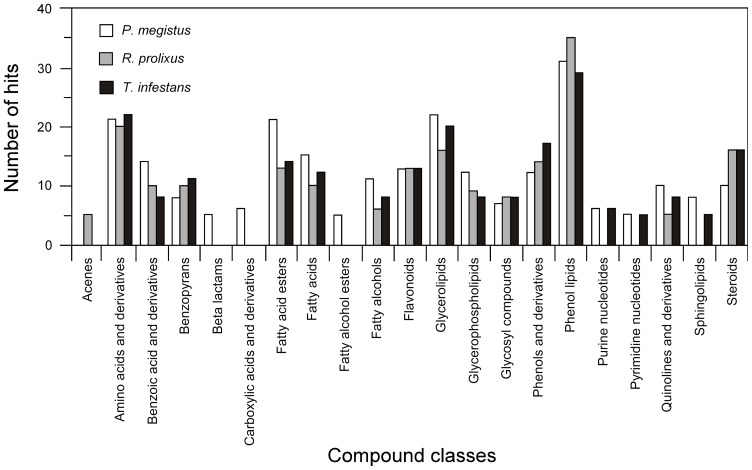
Figure 8. Metabolic classes in the variable core.
Frequency is given in number of hits per metabolic category in the following comparisons: P. megistus vs. T. infestans and R. prolixus (white bars), R. prolixus vs. T. infestans and P. megistus (gray bars), and T. infestans vs. R. prolixus and P. megistus (black bars). Only metabolic classes with 5 or more hits are displayed.

