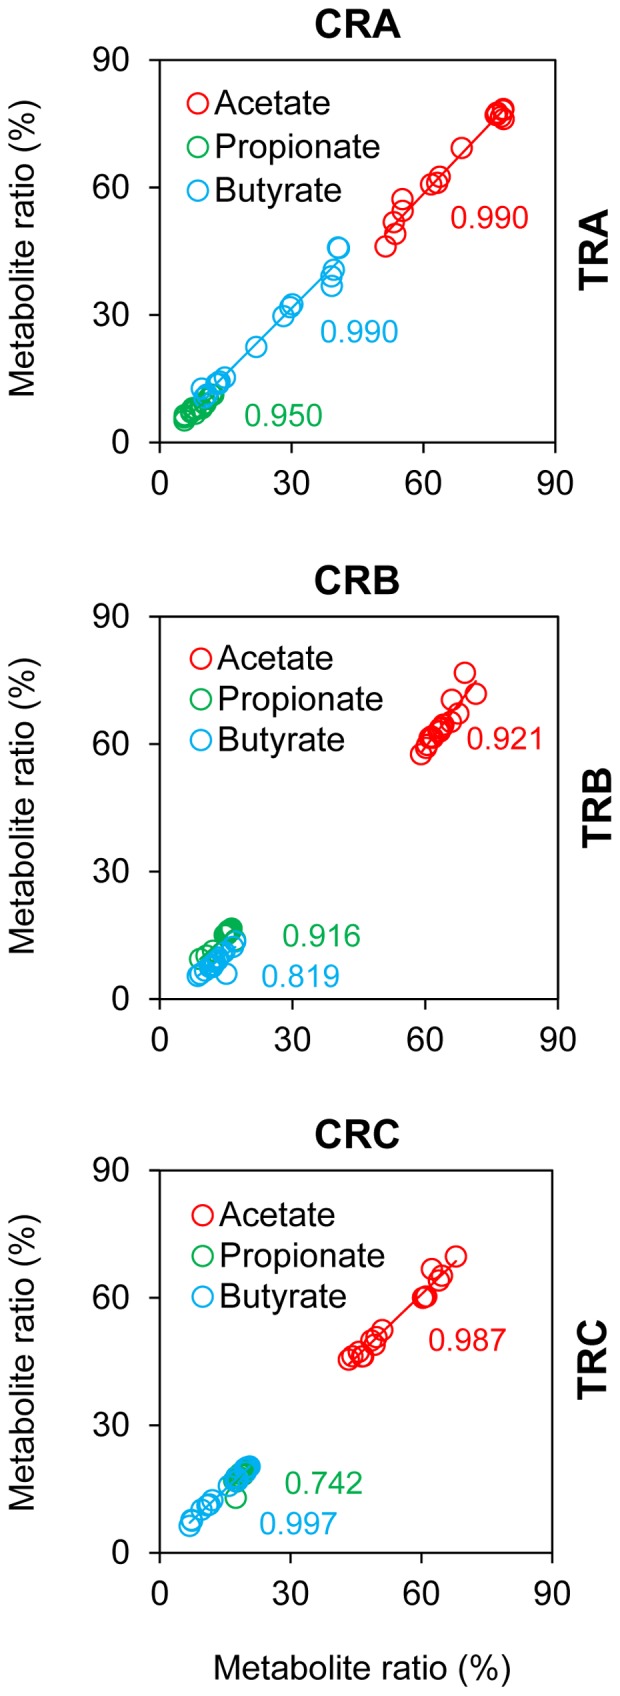
Figure 4. Intra-model reproducibility of metabolic balance measured in effluent samples of PolyFermS models.

Molar metabolite ratios (%) measured daily in control reactors (CRA, CRB and CRB; x-axis) and test reactors (TRA, TRB and TRC; y-axis) from day 6 to 22. Mean daily ratios were calculated for TR1A, TR2A, TR3A (TRA). Numbers in color indicate model-specific Pearson correlation coefficients calculated for acetate (in red), propionate (in green) and butyrate (in blue).
