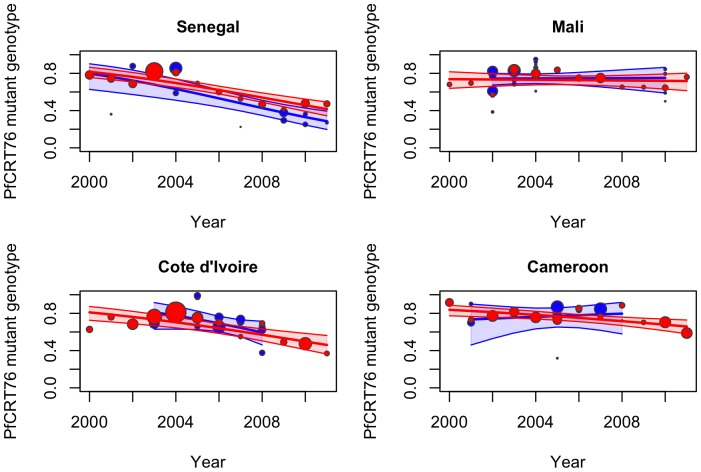
Figure 2. Observed data, fitted model (by logistic regression) and 95% confidence interval (shaded area) for the prevalence of the pfcrt 76 mutant isolates from 2000 to 2011 for travellers (red) and field studies (blue) for A-Senegal, B-Mali, C-Cote d’Ivoire and D-Cameroon.
Each data point represents the prevalence of resistant isolates per year for travellers’ data and per study for field studies, where the size of the circle is proportional to the number of isolates in the sample.

