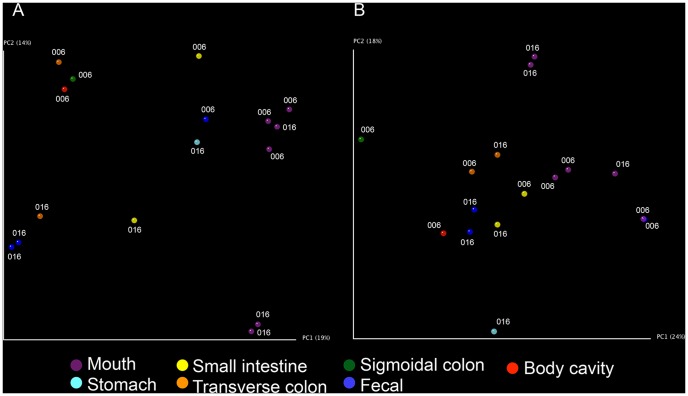
Figure 4. Principal coordinate analysis reveals separation of communities based on location in the gastrointestinal tract.
The first two principal coordinates (PC) of Unweighted (A) and Weighted (B) UniFrac-based principal coordinate analysis are plotted, and the percent variance explained by each PC is indicated in parenthesis.

