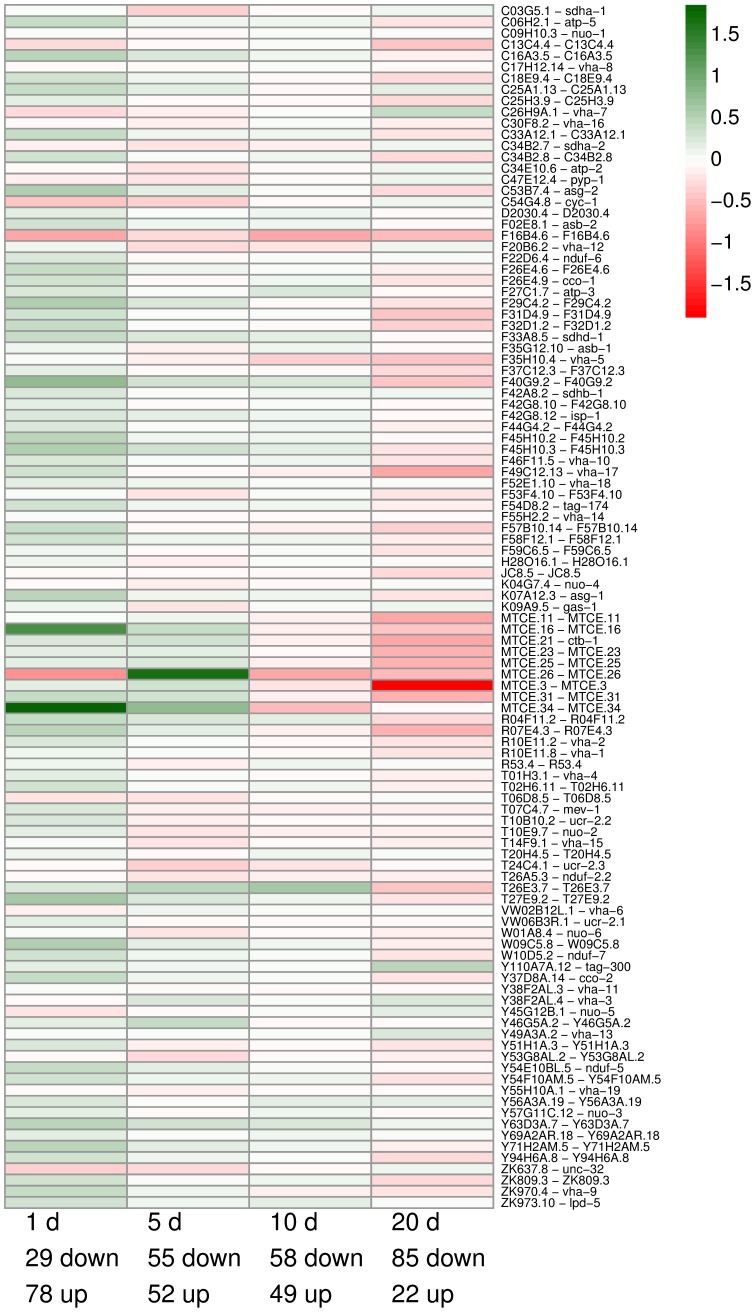
Figure 3. Change of expression levels of 107 oxidative phosphorylation pathway genes during DOG-treatment.
The heatmap shows the log2-foldchange for the expression levels of DOG-treated worms and controls. Green color indicates an up-regulation by DOG-treatment, red color indicates a down-regulation by DOG-treatment, compared to controls. A majority of these genes is down-regulated with age by the DOG-treatment. Note especially the strong regulation of mitochondrially encoded genes (starting with MTCE).

