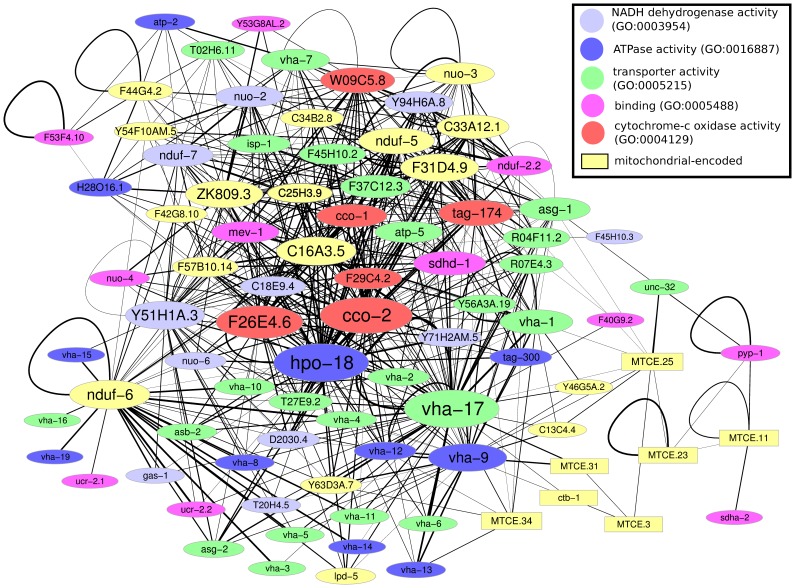
Figure 5. Correlation difference network for genes of the oxidative phosphorylation pathway.
Only edges with a weight were drawn. All black edges represent positive weights, i.e. all shown genes exhibit increased co-expression under DOG-treatment. The line width denotes the extent of correlation difference between DOG and DMSO. Several genes present a hub-like structure with a maximum node-degree of 57 for hpo-18 and vha-17. Mitochondrially encoded genes are represented by rectangular shaped nodes, which show less increased co-expression. The node color denotes the assignment to selected GO categories (see legend).

