Figure 2.
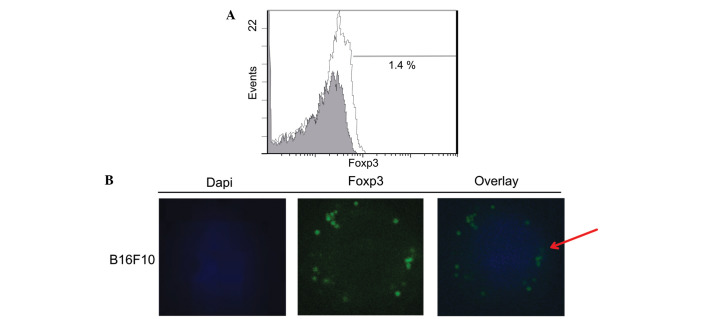
Foxp3 expression in B16F10 murine melanoma cells. (A) B16F10 cells were cultured for 48 h, then collected, permeabilized, stained for Foxp3 and analyzed by flow cytometry. The percentage of Foxp3+ cells is shown. The results are representative of four separate experiments. The white curve represents specific staining for Foxp3, and the gray curve represents the isotype control. (B) B16F10 melanoma cancer cells were fixed and permeabilized prior to Foxp3 staining (green). The nuclei were counterstained with DAPI (blue) and analyzed by confocal microscopy. The red arrows indicates Foxp3.

