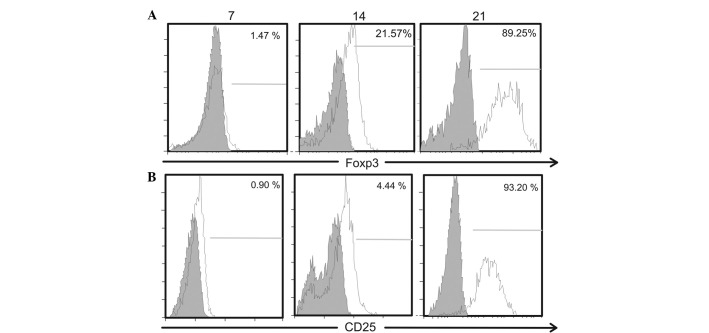
Figure 3.
Analysis of Foxp3 and CD25 expression in intratumoral B16F10 cells during the development of murine melanoma. Tumors were collected at 7, 14 and 21 days after tumor appearance, and intratumoral B16F10 murine melanoma cells were obtained as described in the Materials and methods. (A) The intratumoral B16F10 melanoma cells were adjusted and stained with PE-Cy5 for the Foxp3 analysis. (B) For the CD25 analysis, intratumoral B16F10 cells were stained with PE and analyzed by flow cytometry. The white curve represents specific staining for CD25+ cells, and the gray curve represents the isotype control. The numbers in the histograms indicate the percentage of CD25+ cells. Foxp3, forkhead box P3; PE, phycoerythrin.

