
Figure 3.
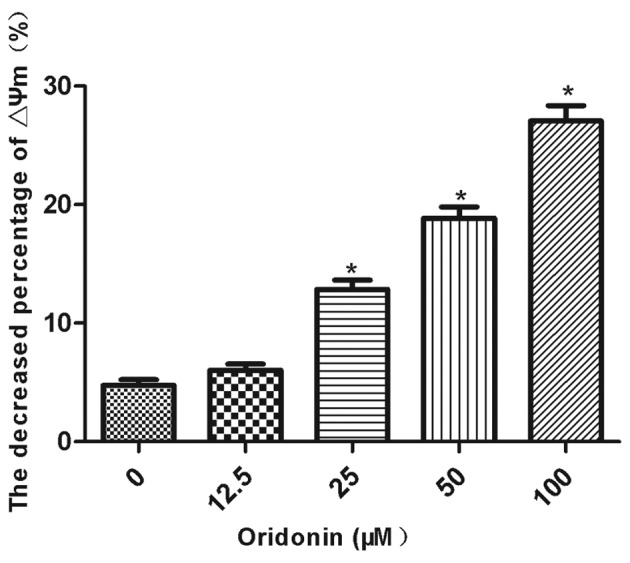
Effect of oridonin on the mitochondrial membrane potential (Δψm) of MHCC97-H cells. The cells were treated with the indicated concentrations of oridonin, and the mitochondrial membrane potential was determined. Data are presented as the mean ± SD of three independent experiments. *P<0.05 compared with the control cells using an LSD t-test. LSD, least significant difference.