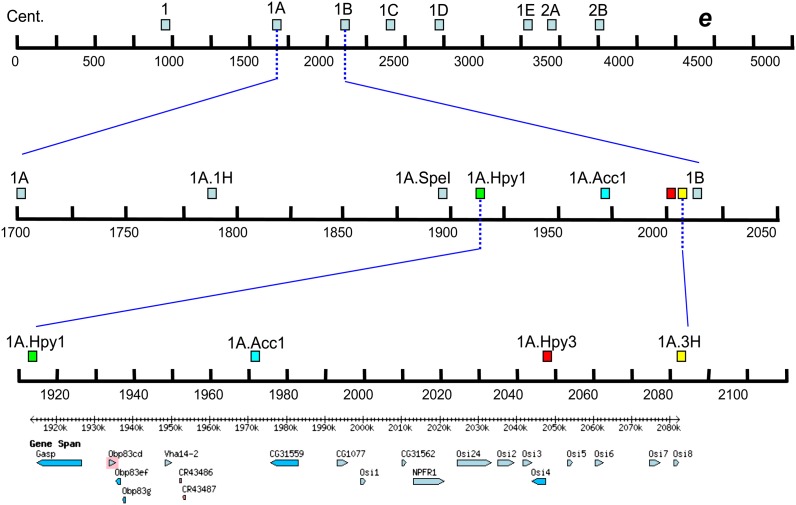
Figure 2.
Map of CAPS markers used to narrow OA tolerance region on chromosome arm 3R. The dashed and solid blue lines indicate zooming in (note the new scale on each level). The light blue boxes on the top level are markers using EcoRI spanning the region on 3R between the centromere (Cent.) and ebony (e). Between the first and second levels, the focus becomes the region between markers 1A and 1B on the second level. The marker names ending in H are for HindIII; SpeI for SpeI; Hyp for HypCH4V; and Acc1 for Acc65I. The markers shaded with light blue are outside of the region of interest. The third level represents the ∼170-kb region between markers 1A.Hpy1 and 1A.3H. These markers are color coded for easy identification between second and third levels. The bottom panel shows the names and positions of the 18 candidate genes (FlyBase). Scale for chromosome position: ×1000.

