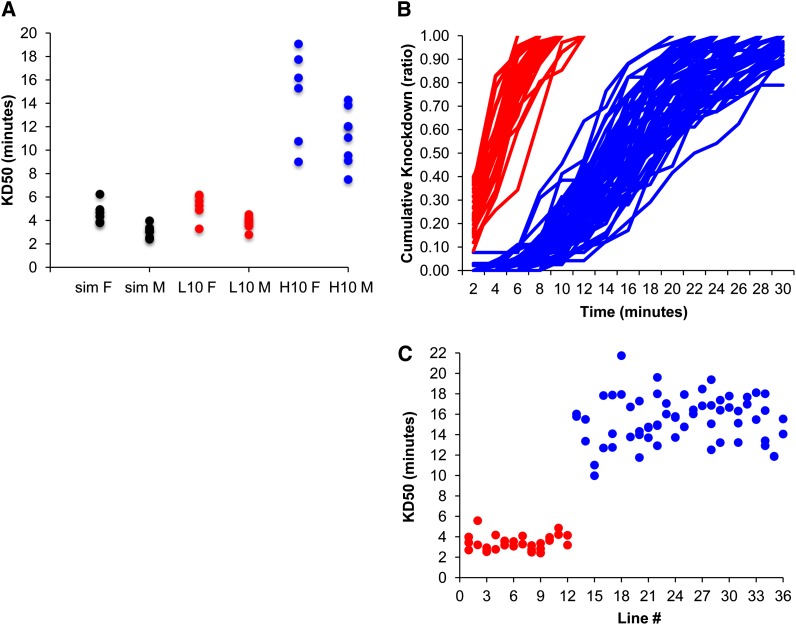
Figure 4.
OA tolerance for gold standard and 36 unknown lines. (A) KD50 of all replicates for females (labeled “F”) and males (“M”), separately, of D. simulans (sim, black), low 10 (L10, red), and high 10 (H10, blue). Plot of the (B) cumulative distribution of knockdown and (C) KD50 for all replicates of the 36 lines of unknown tolerance. The lines/dots clustered into two distinct groups. The blue lines/dots have been classified as high tolerance and the red as low tolerance. None of the lines/dots classified as high tolerance had replicates that clustered with the low tolerance lines and vice versa. Line numbers (1–36) in C correspond to the “Line #”. column in Table S2 (mean KD50s).

