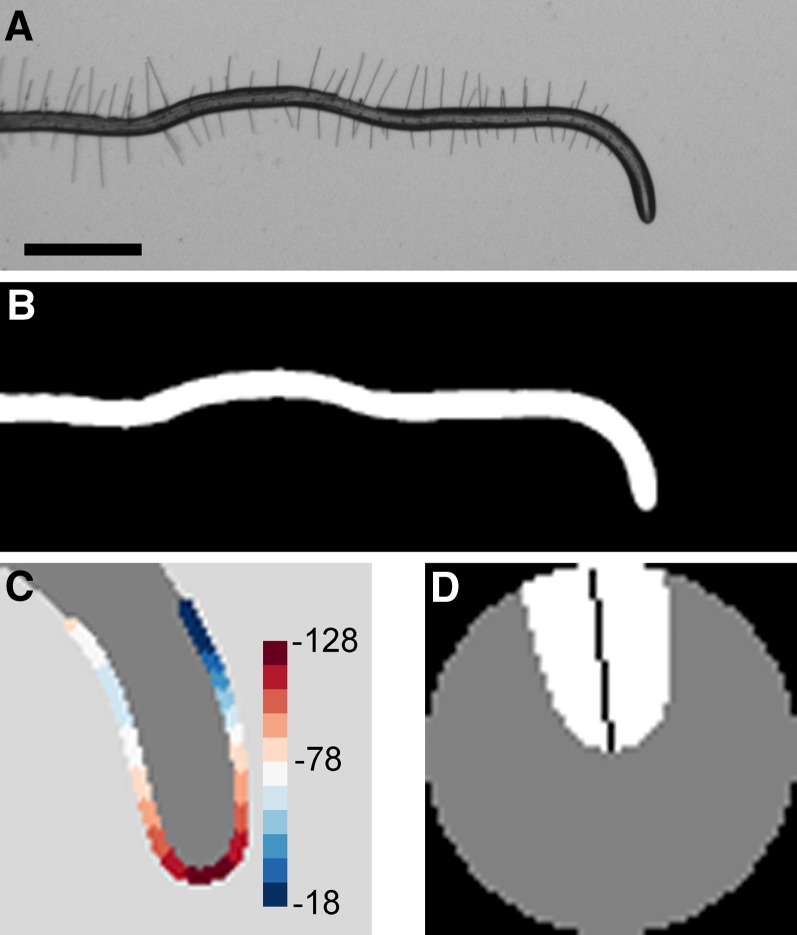
Figure 1.
Root tip angle determined by image analysis. (A) Grayscale image of a representative root undergoing a growth response to a change in the gravity vector, or gravitropism. Bar, 1 mm. (B) Binarized image of the responding root. (C) Curvature values are calculated at each boundary point along the root apex. The point of highest curvature is taken to be the root tip. Color legend indicates curvature values in mm−1. (D) A patch centered at the root tip is subjected to principal components analysis. The first eigenvector (black line) determines the tip angle relative to the horizon.

