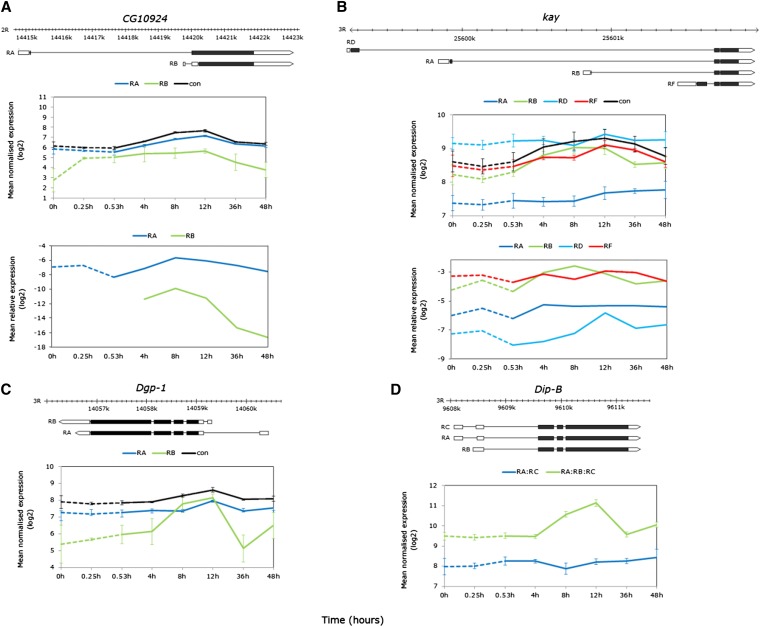
Figure 10.
Examples of differentially expressed isoforms from alternative transcription during recovery from thermal stress. (A–C, top) Gene models showing the different transcript isoforms. (A) CG10924: average normalized log2 expression of the RA, RB, and constitutive exons (middle); average expression relative to RPL11 confirming recovery induction of the RA isoform and differential expression of the RB isoform, although this was out of the PCR range during stress. (B) kay: average normalized log2 expression of all isoform exons and constitutive exons (middle); average expression relative to RpL11 confirming the different temporal profiles of the RB and RF isoforms (bottom). (C) Dgp-1; average normalized log2 expression showing the strong induction of the short RB isoform by 8-hr recovery and the delay in the longer RA isoform until 12-hr recovery (bottom). (D) Dip-B: average normalized log2 expression of the RA:RC subset and constitutive exons illustrating the induction of the shorter RB isoform, which can be inferred from the constitutive exon profile (bottom). The PCR data were log2 transformed for visual clarity and nontransformed data with error bars (±SE of the mean) are shown in Table S7.

