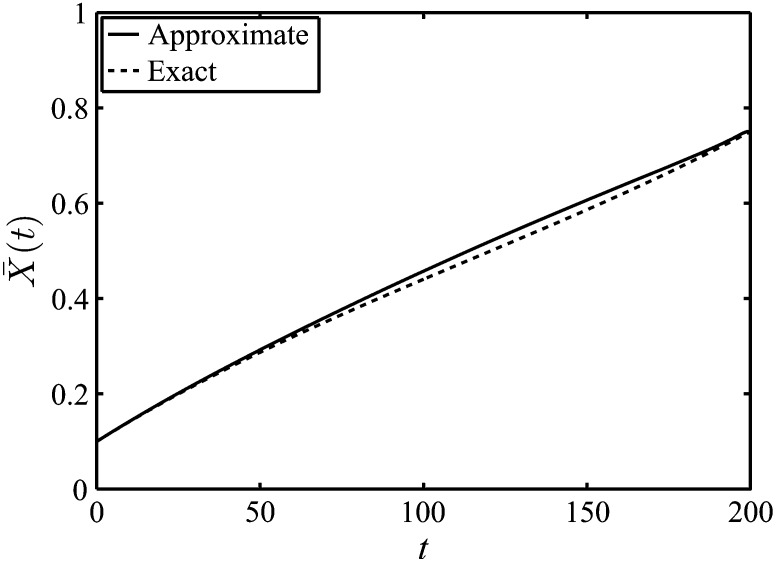
Figure A1.
The expected trajectory when a frequency of 3/4 is achieved at a specific time, say T = 100. We adopt an effective population size of Ne = 100, a real selection coefficient of s = 0.01, and an initial frequency of y = 0.01. The approximate results follow from Equation 9 while the exact results come from a Wright–Fisher model (Fisher 1930; Wright 1931).

