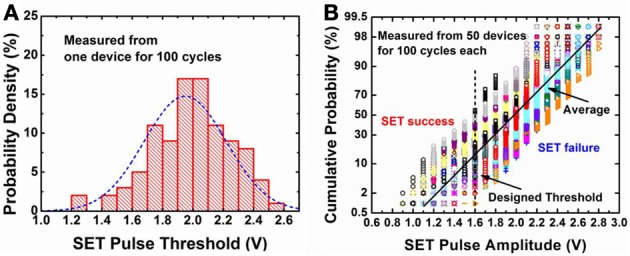
Figure 3.

Measured statistical distribution of pulse amplitude required for triggering the SET switching from the off-state. In (A) the probability of SET switching is measured for one representative device for 100 cycles. In each cycle, a strong RESET pulse (−1.9 V/10 ns) to was applied to achieve a complete off-state (~500 kΩ), then a weak SET pulse with amplitudes from +0.6 V to +3 V (with linearly spaced steps with increasing amplitude) with a 10 ns width was applied to determine the switching probability. Such cycle was repeated for 100 cycles for each device. In (B), 50 different devices on the wafer were measured in the way as described for (A). The data for these 50 devices are presented in (B) with one type of symbol in the figure representing the data from one device. The y-axis in (B) is scaled to be Gaussian, thus a straight line in this plot indicates a Gaussian distribution. If the applied pulse amplitude is 1.6 V, then on average, around 12% of the SET trials will be successful.
