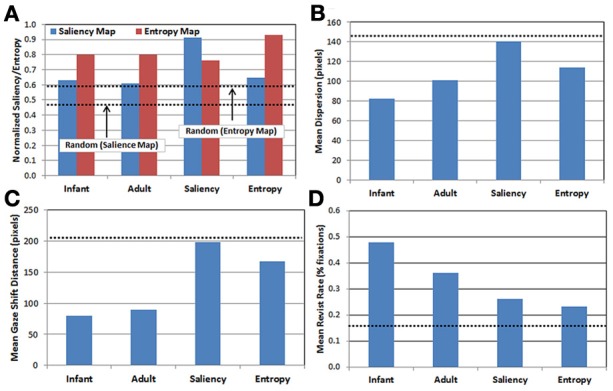
Figure 3.

Comparison of gaze patterns across the 5 observer groups (see text for details). (A) Mean map values calculated by projecting each group's gaze points on to the saliency (blue) and entropy (red) maps, respectively; (B) mean dispersion (spread) of fixations; (C) mean gaze shift distance; and (D) mean proportion of revisits. Dashed lines represent performance of the random observer group.
