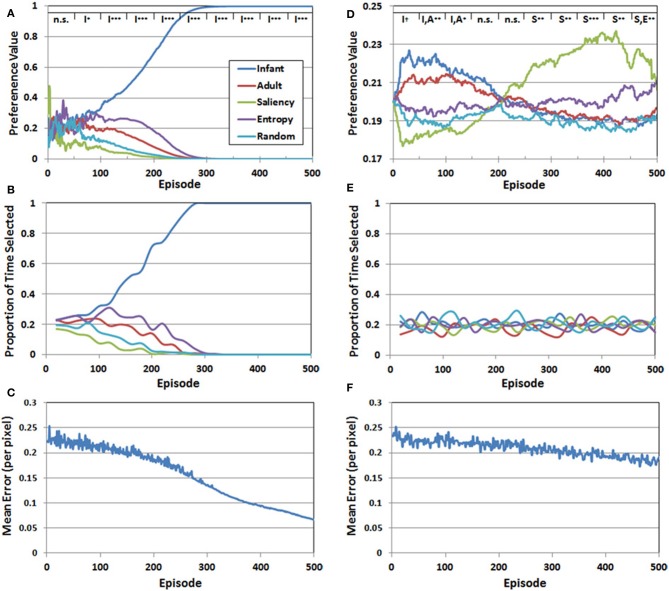
Figure 6.
Set of 3 performance measures for Simulation 1 (A–C) and Simulation 2 (D–F). The legend at the top of panels (A,D) represents the results of planned comparisons between the observer groups (n.s. = not significant, †< 0.06, *< 0.05, **< 0.01, ***< 0.001). See the text for additional details.

