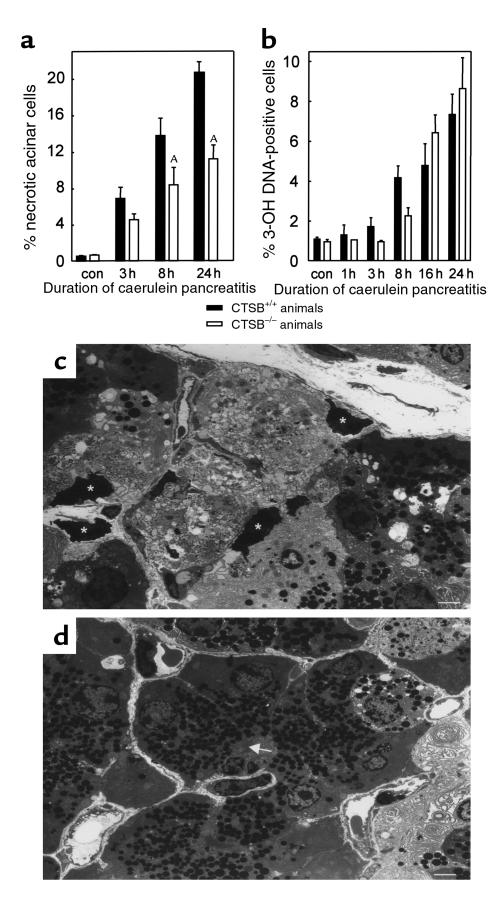
Figure 4.
Pancreatic necrosis and apoptosis during experimental pancreatitis. The time course over 24 hours is shown for (a) the percentage of acinar cells that had undergone necrosis and (b) the percentage of cells that had undergone apoptosis after the induction of pancreatitis. The appearance of necrotic acinar cells was quantitated in electron microscopy sections and the number of apoptotic cells was determined using fluorescence labeling of DNA-strand brakes and was expressed as percentage of all DAPI-positive nuclei. Data points represent the means of three or more animals at each interval ± SEM. ASignificant differences (P < 0.05) between the CTSB+/+ and the CTSB–/– mice. In c, a representative micrograph is shown from the pancreas of a wild-type animal after 24 hours of pancreatitis. Note the prominent areas of acinar cell necrosis with resolution of cellular membranes and organelles as well as dark condensed nuclei (asterisks). In d, a corresponding section from a CTSB–/– animal is shown. Here more intact acinar cells with densely packed zymogen granules around the acinar lumen (arrow) are seen, and the area of necrosis is confined to the right-hand margin of the micrograph. Calibration bars = 10 μm.

