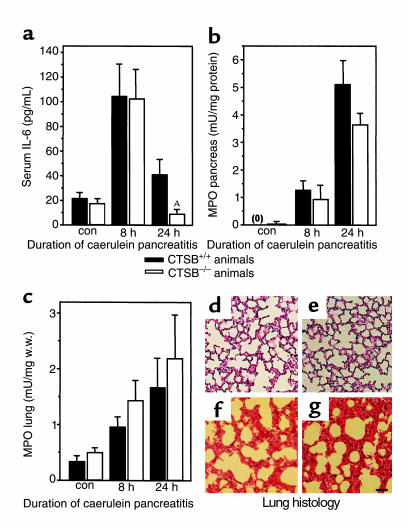
Figure 5.
Extrapancreatic manifestations of experimental pancreatitis. The time course over 24 hours is shown for (a) serum concentrations of IL-6, (b) MPO levels in the pancreas, (c) MPO levels in the lungs, and (d–g) morphological changes in the lungs. Data points represent the means of five or more animals at each interval ± SEM. ASignificant differences (P < 0.05) between CTSB+/+ and CTSB–/– animals. (d–g) Representative examples for the lung histology of saline-injected control (CTSB+/+, d; CTSB–/–, e) mice, and pancreatitis animals at 24 hours of the disease (CTSB+/+, f; CTSB–/–, g) are shown. Note that the thickening of the interalveolar tissue, its hyperemia, and the infiltration by leukocytes are indistinguishable between the CTSB+/+ and CTSB–/– group of animals. Calibration bar = 100 μm.

