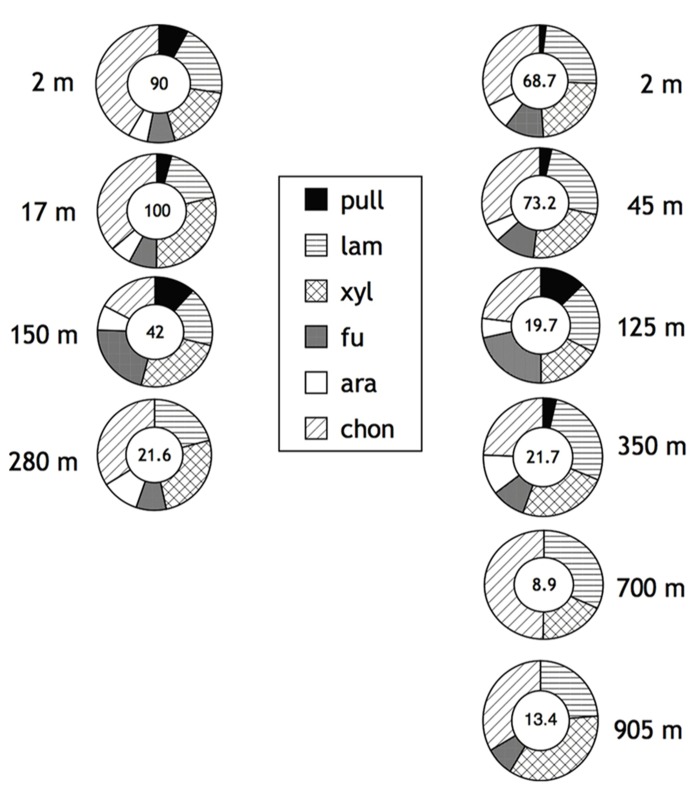
FIGURE 2.
Enzymatic hydrolysis rates of polysaccharides in depth profiles of Stations 2 (left) and 3 (right) in the northern Gulf of Mexico (see Materials and Methods for specific location). Water column depth shown to the left of Stn. 2 samples, to the right of Stn. 3 samples. Number in center of circle corresponds to summed maximum hydrolysis rate (nmol monomer L-1 h-1) of enzyme activities. Shading of circle shows relative contribution of each activity to the total measured. Pull, pullulan; lam, laminarin; xyl, xylan; fu, fucoidan; ara, arabinogalactan; chon, chondroitin sulfate. Data replotted from Steen et al. (2012).

