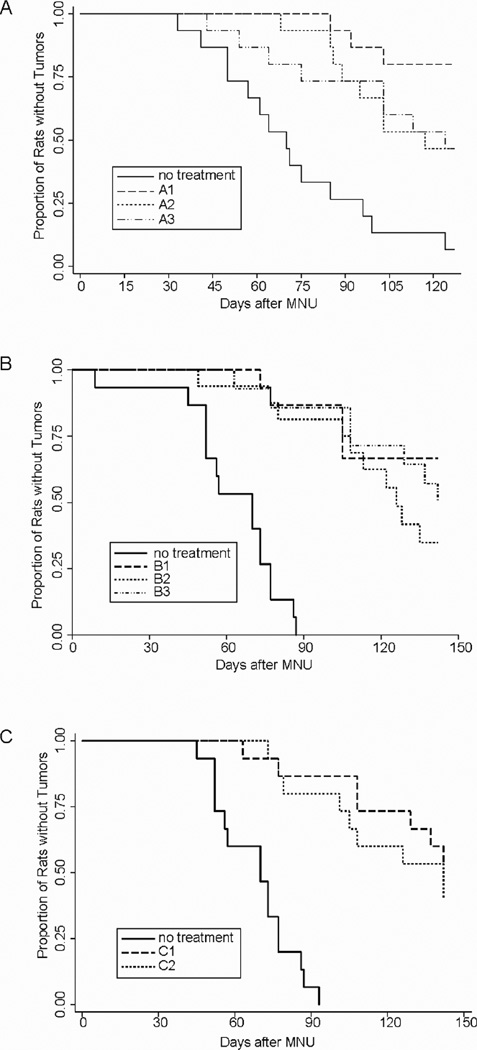
Figure 1.
Effect of Erlotinib (6 mg/kg BW/day) on Time of Tumor-Free Survival in Methylnitrosourea-Induced Mammary Cancers in Female Sprage-Dawley Rats. 1A. The groups were: no treatment (solid line), erlotinib given daily (A1, dashed line), erlotinib given one day on/one day off (A2, dotted line), and erlotinib given two days on/two days off (A3, dashed/dotted line). P-values for log-rank test of survival curve equality: A1 vs control, <0.0001; A2 vs control, 0.0010; A3 vs control, 0.0031; A1 vs A2, 0.0656; A1 vs A3, 0.0617; A2 vs A3, 0.9542. 1B The various groups were: no treatment (solid line) erlotinib (6 mg/kg BW/day) given daily (B1, dashed linexref>), erlotinib (6 mg/kg BW/day) given two days on/two days off (B2, dotted line), and erlotinib (42 mg/kg BW) given 1x/week (B3, dashed/dotted line). P-values for log-rank test of survival curve equality: B1 vs control, <0.0001; B2 vs control, <0.0001; B3 vs control, <0.0001; B1 vs B2, 0.1604; B1 vs B3, 0.5016; B2 vs B3, 0.3351. 1C. The groups were: no treatment (solid line), erlotinib (42 mg/kg BW) given 1x/week (C1, dashed line), and erlotinib (21 mg/kg BW) given 1x/week (C2, dotted line). P-values for log-rank test of survival curve equality: C1 vs control, <0.0001; C2 vs control, <0.0001; C1 vs C2, 0.4372.

