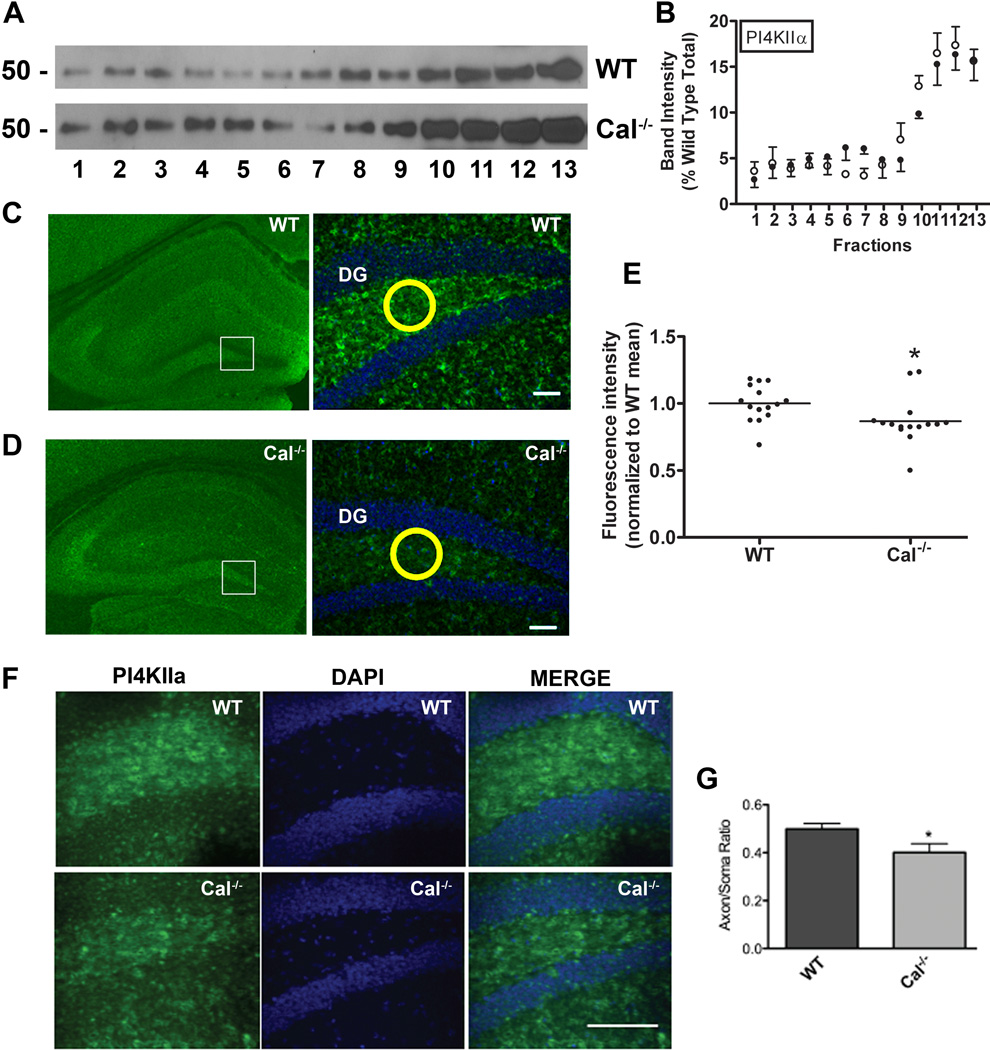
Figure 6. Calcyon regulates expression of PI4KIIα in the hilus of the dentate gyrus.
A. Sedimentation profile of PI4KIIα in glycerol gradient fractions prepared from wild type (WT) and Cal−/− brains determined by immunoblotting. B. Distribution of PI4KIIα across the WT (closed circles) and Cal−/− (open circles) gradients following normalization to the total present in the WT samples. Molecular weight markers are shown to the left. C, D. PI4KIIα immunostaining in WT (C),, and Cal−/− (D) hippocampus at low (left) and high (right) magnification. Fluorescent staining intensities were obtained in circles (such as shown in yellow) of equal area positioned over the hilus. Staining in Cal−/− samples was normalized to that detected in WT samples in the same rostral-caudal location. E. Scatter plot showing values for each sample with horizontal line indicating the SEM. Compared to levels detected in WT, PI4KIIα levels in the hilus of the Cal−/− dentate gyrus are significantly reduced (*, p<0.05, t-test). F. Higher magnification (40×) view of PI4KIIα staining of granule cells (green). Nuclei were detected with DAPI (blue). The axon/cell body staining ratio for each sample was determined following measurement of PI4KIIα labeling in the cell body area and adjacent mossy fibers using circles of equal area as described above. Bar= 100 µM G. Histogram with bars and error bars showing the mean axon/soma ratio, and the SEM for the WT and Cal−/− samples (*, p<0.05, t-test). The ratio is significantly reduced in Cal−/− samples indicating impaired sorting of PI4KIIα to axons.

