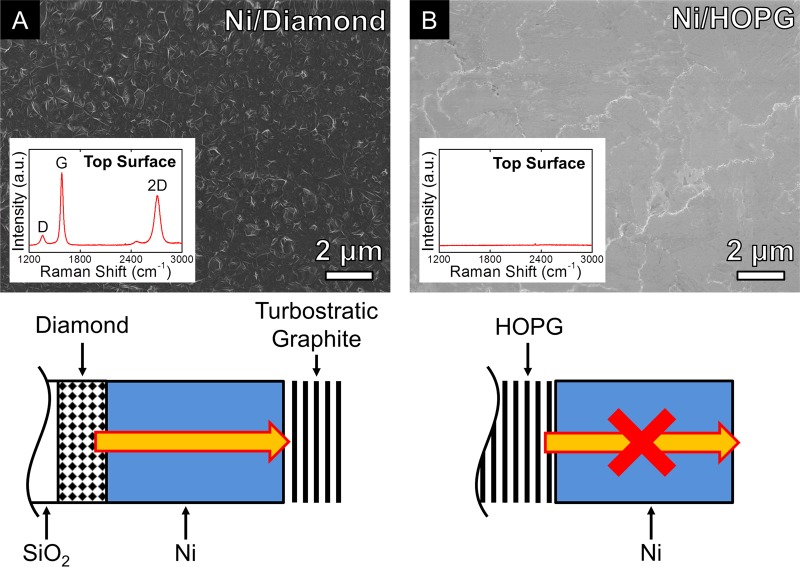
Figure 5.
Scanning electron micrographs of Ni(550 nm)/diamond(∼100 nm) (A) and Ni(550 nm)/HOPG (B) annealed at ∼600 °C for 5 min in vacuum (heated at a fixed rate of 100 °C min–1, cooled at ∼300 °C min–1). All scalebars are 2 μm. Insets show the corresponding Raman spectra measured on the as-grown samples. Sketches indicating the effect of annealing on each of the samples are also shown.

