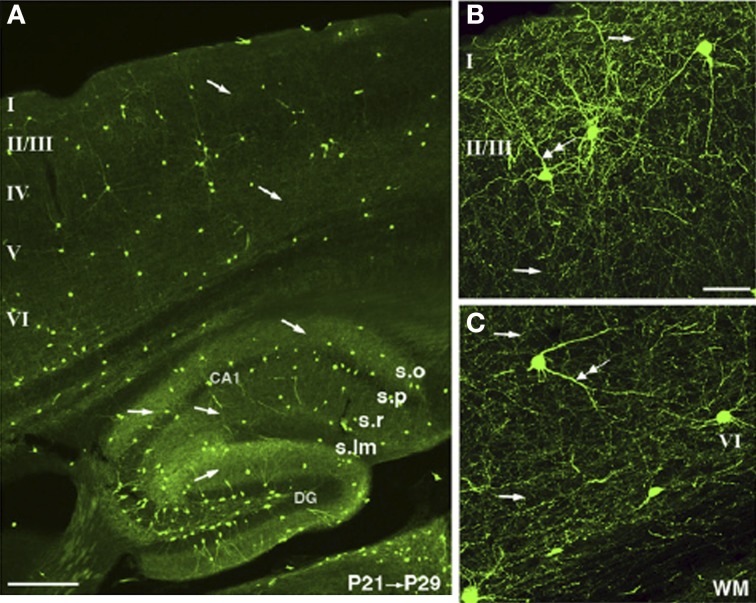
Figure 2.
NOS1 positive cells at the LM level in the Cortex and Hippocampus. Cells expressing TdTomato fluoresce in nNOS positive cells in an nNOS-CreER;Ai9 mouse. The TdTomato is rendered green in the images. (A) The nNOS positive cells make up a small population scattered in cortex and hippocampus. (B) A dense and diffuse plexus of neuropil can be seen throughout layer II/III and (C) throughout deeper layers of the cortex. Single arrows indicate axons and double arrows dendrites. Adapted from Taniguchi et al. (2011) with kind permission of the authors and Cell press.

