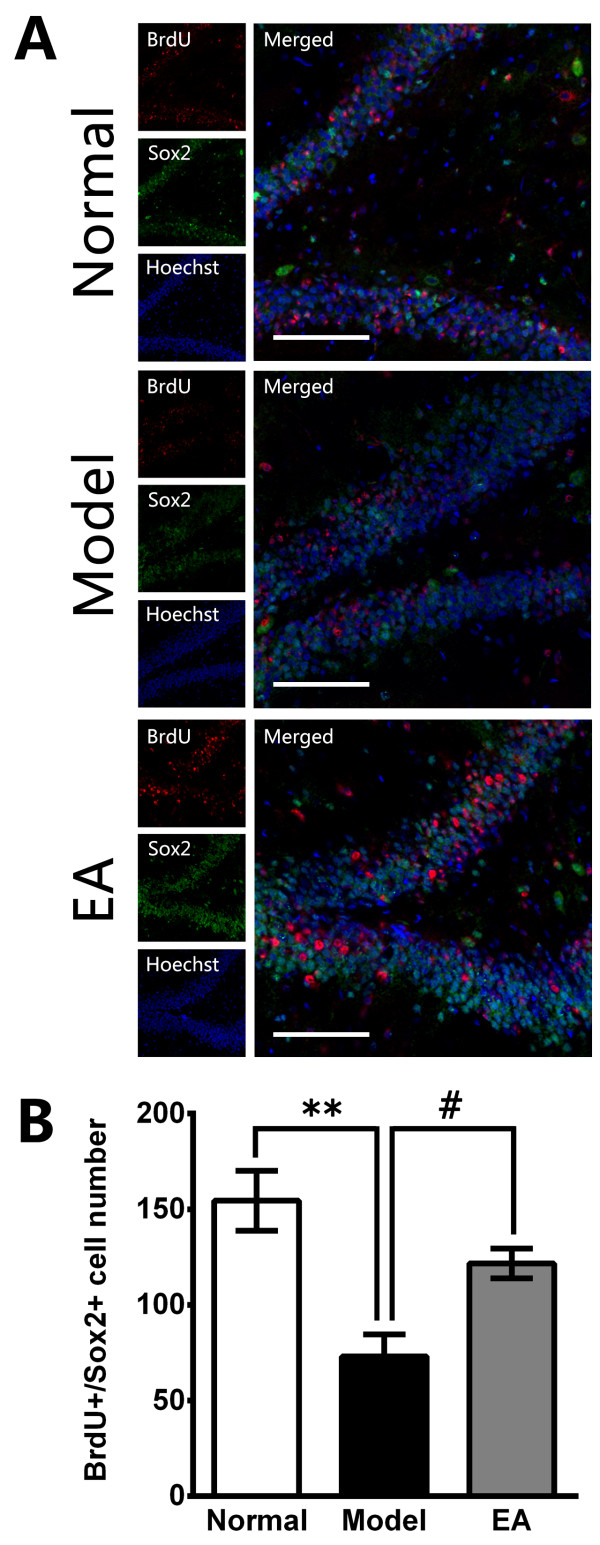
Figure 2.
The effects of EA on stem cell proliferation in the hippocampal dentate gyrus (DG) after 4 weeks. (A) Representative triple immunofluorescence staining for BrdU + (red), Sox2+ (green) and Hoechst (blue) in the central region of the DG. Scale bar = 100 μm. (B) Quantitative representation of Sox2/BrdU double-positive cells in the DG zone (not only those regions in A) per section. EA treatment significantly improved the stem cell proliferation compared with the CUS Model. The values are the mean ± SE, n = 5 in each group. ** P <0.01 (Model vs. Normal); # P <0.05 (EA vs. Model).

