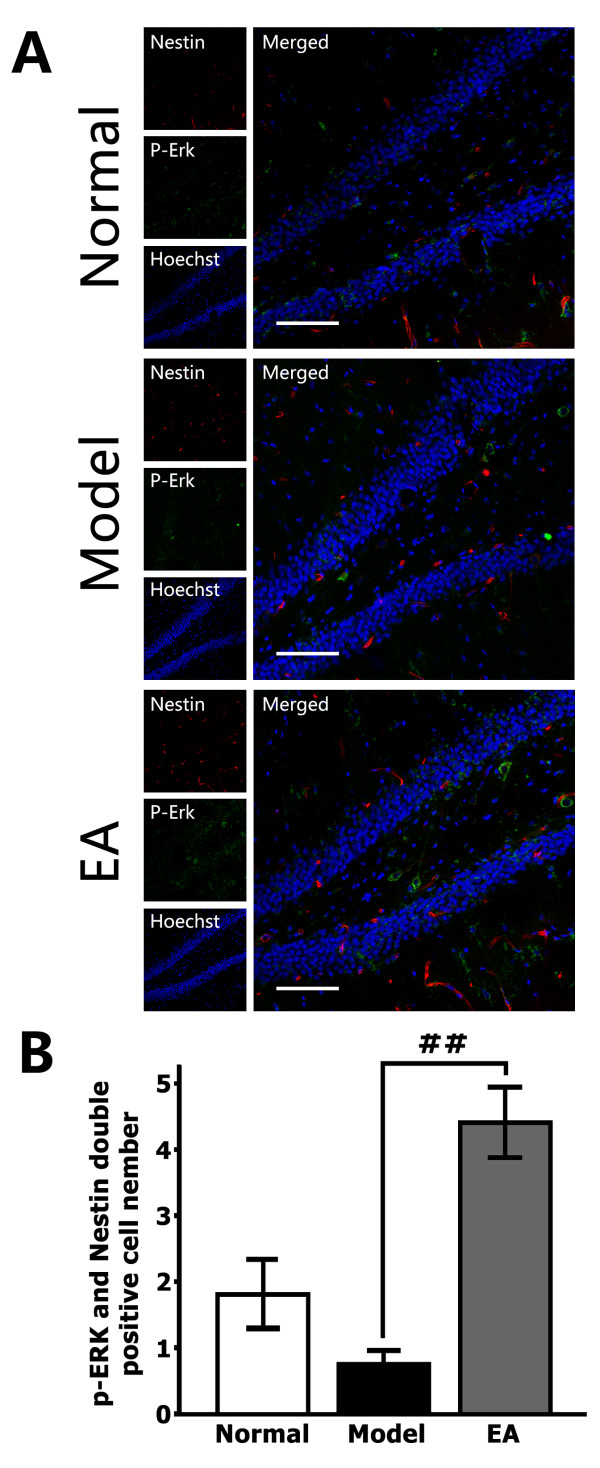
Figure 3.
Induction of ERK phosphorylation (p-ERK) in DG stem cells by EA (8 treatments). (A) Representative triple immunofluorescence staining for Nestin (red), p-ERK (green) and Hoechst (blue) in the central region of the DG. Scale bar = 100 μm. (B) A quantitative representation of Nestin/p-ERK double-positive cell numbers in the DG zone (not only those regions in A) per section. EA treatment significantly elevated p-ERK levels in NSCs in the hippocampal DG of stressed rats. ## P <0.01.

