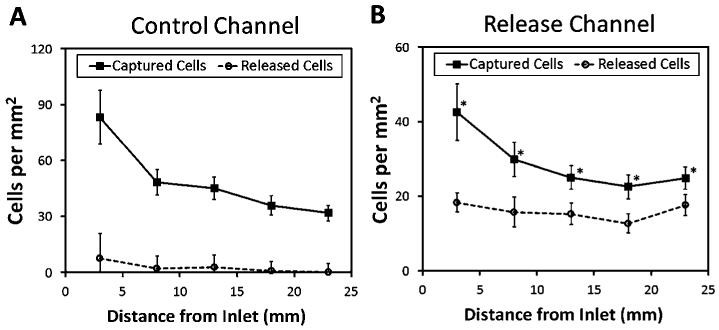
Fig. 4.
Distribution of captured and released cells along the microfluidic channels. (A) In control channels, captured cells were concentrated closer to the inlet with a decreasing distribution along the channel. After cooling down and rinsing, the number of released cells were significantly lower along the channels. (B) In release channels, more cells were captured closer to the inlet and the number gradually decreased along the channels. After release steps, a comparable number of cells were released along the channels. The difference between the number of captured and unreleased cells (i.e., the number of released cells subtracted from the number of captured cells) along the channel was statistically significant (n = 6 channels, 10 images per channel, * indicates p < 0.05, paired t-test). Error bars represent the standard error of the mean.

