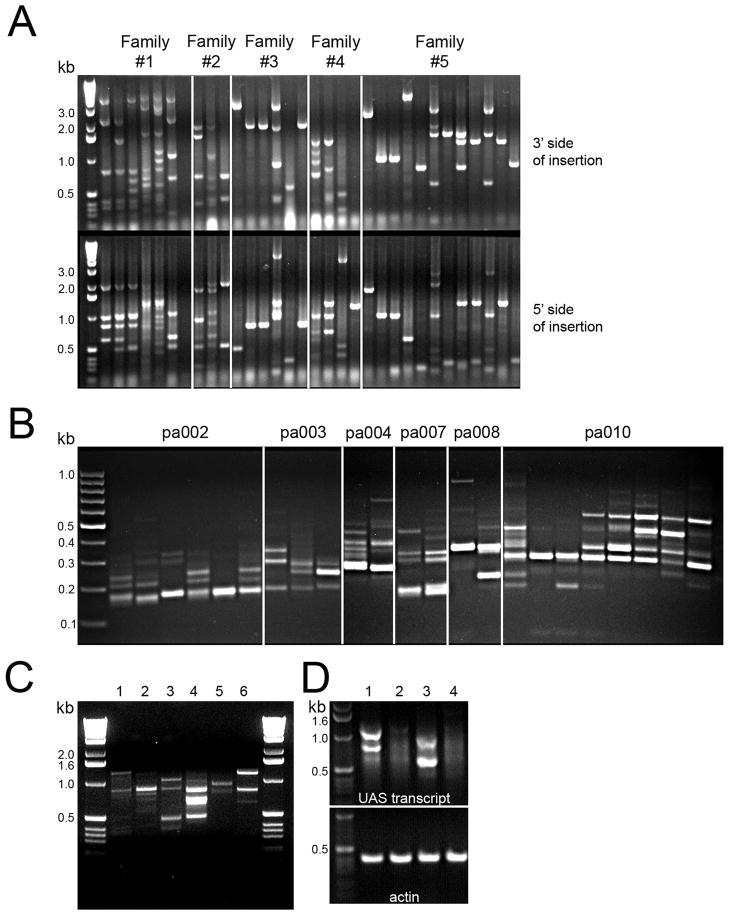
Figure 2. The gene-activation virus integrates throughout the zebrafish genome and downstream genes are targeted for overexpression.
A – inverse PCR for F1 embryos. Each lane is DNA for an individual embryo with 5 different families represented. Each band is a unique viral insertion with both flanking genomic regions analyzed. B – linker-mediated PCR using genomic DNA from F1 fish previously genotyped for a selected insertion. Each lane is a separate fish representing 6 different families. The number of stable insertion in these fish varies from 1 to 7 insertions. C – overexpression of genes downstream of viral insertions. Each lane represents an individual family with embryos obtained by crossing to Tg(ath5:Gal4VP16) and pooled at 48 hours post fertilization. Each band is a unique gene induced by Gal4-VP16. The number of overexpressed genes can vary from one (lane 5) to multiple genes (lane 4). D- Two families of F1 embryos were analyzed after crossing to wild-type (lanes 2 and 4) or Tg(ath5:Gal4VP16) lanes 1 and 3) using RT-PCR. Gal4 induced transcripts are detected only in the presence of Gal4-VP16.

