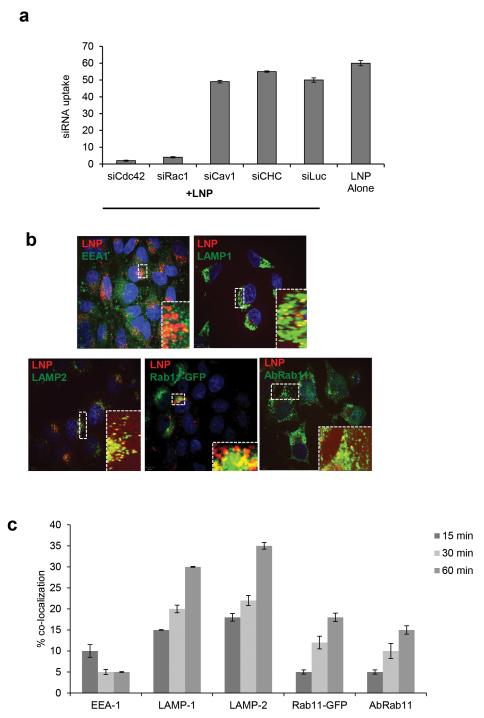
Figure 2. Cellular trafficking of LNPs.
a. Quantitative image analysis of siAF647-LNP cellular uptake (3 hrs) in HeLa cells silenced with siRNA against key endocytic regulators (Cdc42, Rac-1, Clathrin heavy chain (CHC), caveolin-1 (Cav-1). siRNA against luciferase serve as a negative control. (b-c) Image based quantitative analysis of siAF647-LNPs co-localization (3 hrs pulse, 15, 30, 60 min. chase) with markers of endocytosis, anti-EEA-1 (early endosomes), anti-LAMP-1 (late endosome/lysosomes), anti-LAMP-2 (late endosomes/lysosomes), Rab11-GFP and anti-Rab11 (both mark endocytic recycling compartment). High-resolution z-stack confocal images representative of 60 min chase are presented in different panels (b). Quantification of LNP-siRNA cellular uptake after indicated times (a, c).

