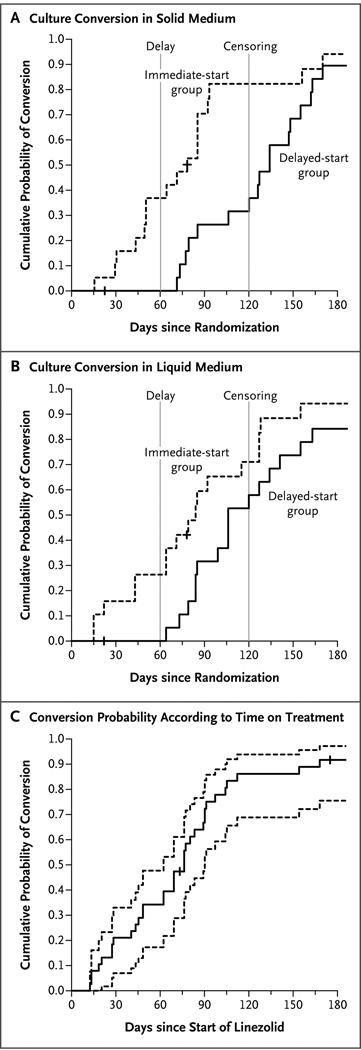
Figure 2. Kaplan–Meier Curves for Culture Conversion According to Time since Randomization.
Panel A shows the results for solid culture medium, and Panel B the results for liquid culture medium. In both panels, the dashed vertical lines indicate the start of treatment (at 2 months) in the delayed-treatment group and the time of data censoring (at 4 months). Panel C shows the time to culture conversion on solid medium (solid line) along with the 95% confidence interval (dashed lines) for the 38 participants who received linezolid, according to the duration of linezolid therapy. Tick marks indicate the censored observations at the time of the last follow-up visit with culture results.

