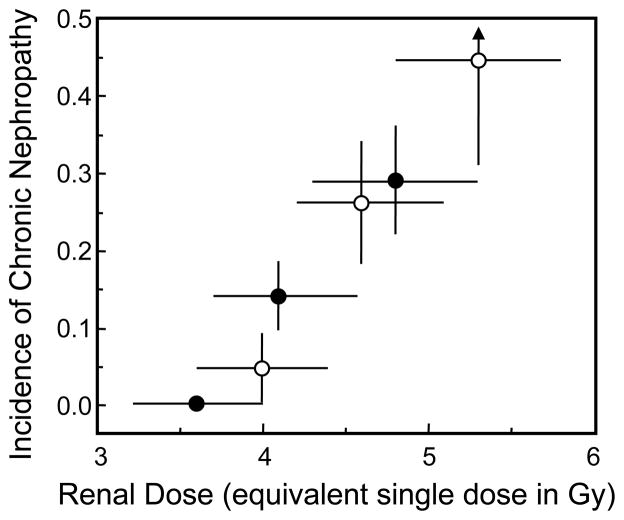
Fig. 1.
Dose–response curve for chronic nephropathy after TBI plus HSCT from the clinical reports of Lawton et al. [47] (●) and Miralbell et al. [48] (○). The “equivalent single dose” is derived from the actual fractionated low-dose-rate regimen by assuming an α/β of 1.5–4.0 Gy for the fractionation effect, and a dose-rate-reduction factor of 1.2–1.5 for the dose-rate effect. The vertical error bars are standard deviations; the horizontal error bars reflect the biological uncertainty in the “equivalent single dose” calculation. Reprinted with permission from Moulder and Cohen [6].

