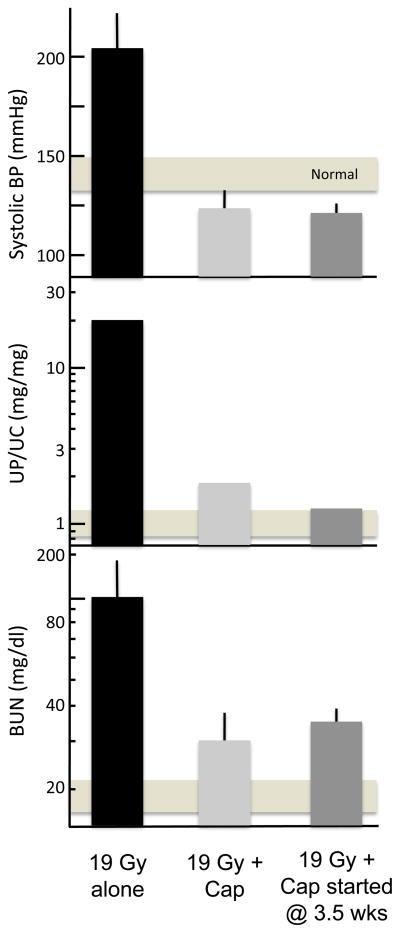
Fig. 3.
Effect of continuous captopril (Cap) therapy vs. captopril therapy started 3.5 weeks after BMT on renal function 26 weeks after fractionated TBI plus BMT in a rat model. The top panel shows blood pressure, the center panel shows proteinuria, and the bottom panel shows azotemia (as BUN). Values shown are geometric means with 95% confidence intervals. The horizontal bar shows the 95% confidence intervals for age-matched control rats. Adapted with permission of Bone Marrow Transplantation, from Moulder et al. [12].

