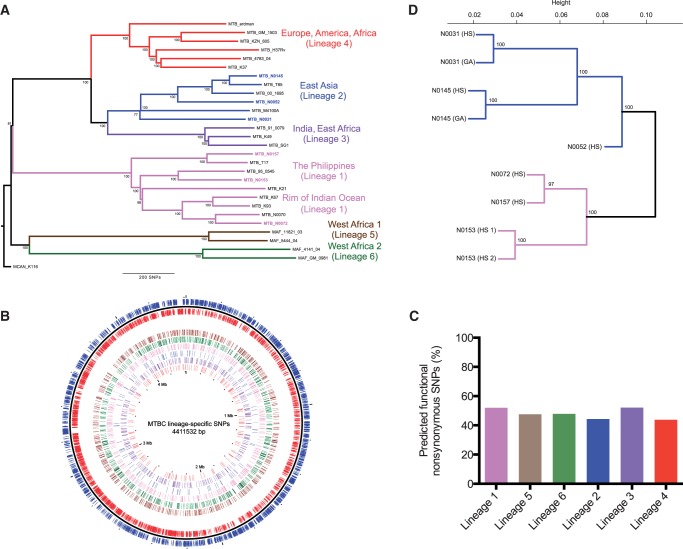
Fig. 1.—
The influence of genomic diversity at the transcriptomic level. (A) Neighbor-joining phylogeny based on 28 representative MTBC strains, using 13,086 variable positions. The six main lineages are named and branches colored as defined previously (Gagneux et al. 2006; Hershberg et al. 2008). Node support after 1,000 bootstrap replications is shown on branches and the tree is rooted by the outgroup Mycobacterium canetti. (B) Genome distribution of 2,772 lineage-specific SNPs. Moving from the outer to innermost ring: forward (blue) and reverse (red) genes, lineage-specific SNPs (Lineage 6, 5, 1, 2, 3, 4). (C) Percentage SIFT predicted functional nonsynonymous SNPs per lineage. (D) Unsupervised hierarchical clustering of total gene expression of all annotated genes (4,015). Strain replicates are also shown (strain N0153, N0145, and N0031). Node support after 1,000 bootstrap replications is shown for each branch.

