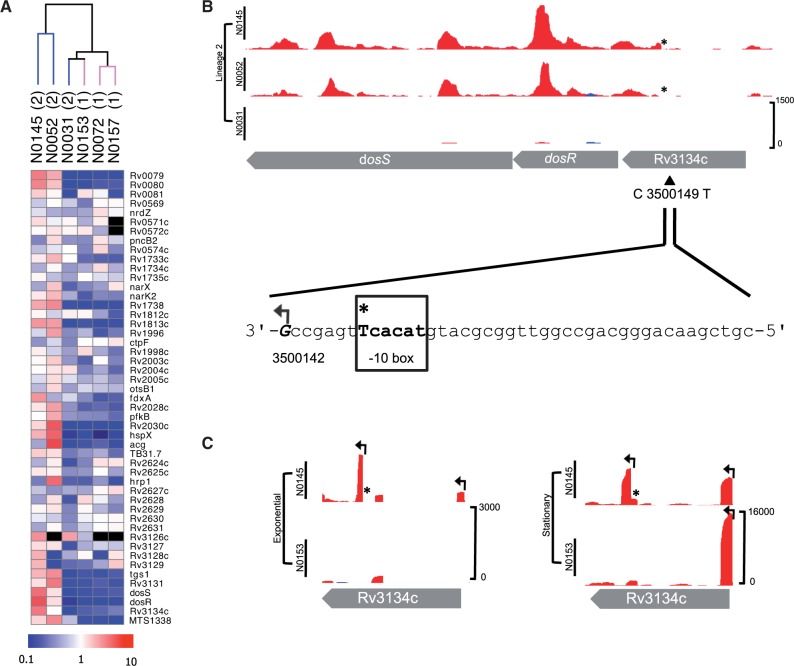
Fig. 2.—
DosR regulon and SNP-associated TSS. (A) Heatmap of regulon (comprising of 48 genes and 1 sRNA) in the six strains. Unsupervised hierarchical clustering of strains by normalized gene expression of the regulon separates Lineage 2 Beijing subgroup strains (N0145 and N0052). Scale bar indicates fold change, from 10-fold downregulation (blue) to 10-fold upregulation (red). Genes not expressed are colored black. (B) Exponential phase mapped RNA-seq reads in Lineage 2 strains for dosR. Plot shows reads mapping to the forward (blue) and reverse (red) DNA strand. Plots are shown at an identical scale with scale bar indicating maximum read depth included in the bottom panel (this convention is kept for all plots). The C to T SNP in Beijing strains is indicated with an asterisk (*) and the new TSS 7 nucleotides from the created -10 box highlighted. (C) RNA-seq TSS mapping for strain N0145 (Lineage 2) and N0153 (Lineage 1) grown at exponential and stationary phases; TSS shown with arrows. The Beijing-specific TSS within Rv3134c is expressed in both phases.

