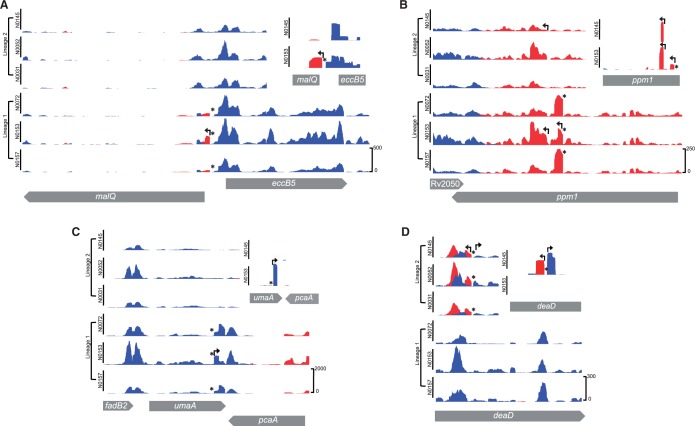
Fig. 3.—
Examples of SNP-associated TSS. For each example, the main panels show total transcriptome profiles for the six strains; insets in the top right show TSS mapping for strain N0145 (Lineage 2) and N0153 (Lineage 1). Lineage-specific SNPs are indicated with an asterisk. (A) Intergenic TSS: Lineage 1 SNP (T 2017560 A) is associated with a new TSS and increased expression of malQ in the respective strains. (B) Internal coding TSS: Lineage 1 SNP (C 2309356 T) within ppm1 is associated with a new TSS and upregulation of ppm1 transcription. A second internal TSS present in all strains also indicated in the TSS mapping inset. (C) Internal coding TSS and 3′ antisense: SNP-associated TSS in 3′ region of umaA in Lineage 1 strains is associated with higher umaA expression and pcaA antisense expression. (D) Internal coding TSS and antisense: SNP within deaD in all Lineage 2 strains is associated with a new TSS and increased antisense transcription. The SNP also creates a -10 consensus on the forward strand; this is associated with a new TSS but has no significant impact on the level of sense transcription.

