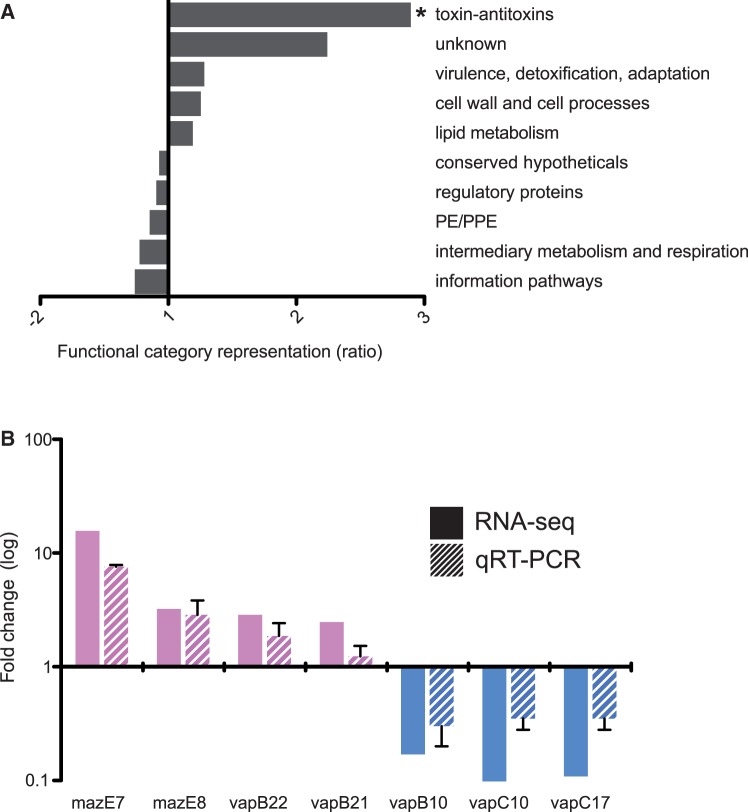
Fig. 4.—
Overrepresentation of differentially expressed toxin–antitoxins (TAs). (A) Ratio of significant differential gene expression grouped by functional category, compared with the genome-wide representation of the category. Values on the x axis represents the difference as fold change, positive fold change indicates overrepresentation of a particular function category and negative values underrepresentation. There were 2.9-fold more toxin–antitoxins than expected (χ2, P = 0.03). (B) Validation of selected RNA-seq differentially expressed toxin–antitoxins (solid bars) by qRT-PCR (striped bars). Fold change relative to Lineage 1 expression on y axis (log10 scale) and bars colored by lineage with higher expression. Error bars for qRT-PCR indicate the standard deviation of three biological replicates.

