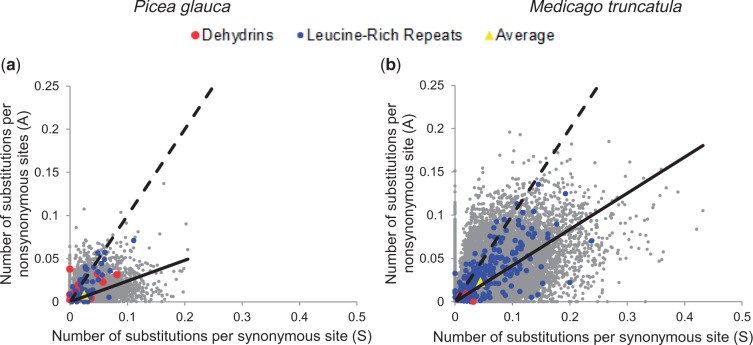
Fig. 2.—
Number of substitutions per nonsynonymous site (A) and number of substitutions per synonymous site (S) for P. glauca (13,498 genes; a) and Medicago truncatula (30,768 genes; b) genes encompassing SNPs. The yellow triangles represent the averages. The dashed line represents the null expectation if substitutions were randomly distributed (A = S). The solid line is the slope averaged over all data (average A for all coding sequences divided by average S for all coding sequences). Data points for genes from two families involved in response to biotic stress (LRR family) and abiotic stress (dehydrins) are colored.

