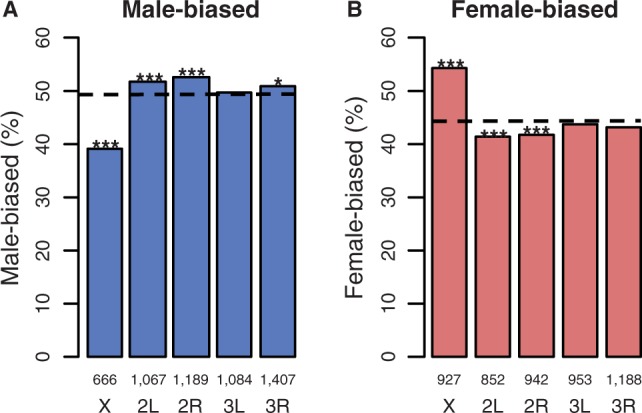
Fig. 2.—

The genomic distribution of sex-biased genes in D. serrata: (A) male-biased and (B) female-biased. The dotted line is the expected percentage of sex-biased genes per chromosome from 1,000 random permutations of the data; numbers above chromosome labels indicate the number of genes in each bar, and asterisk indicates probablilty that observed value does not differ from expected: ***P < 0.001, **P < 0.01, *P < 0.05.
