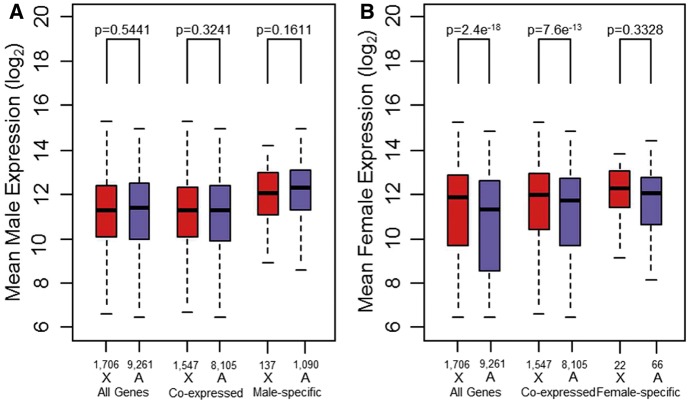
Fig. 4.—
Dosage compensation via hyperexpression in both sexes. (A) Boxplots showing mean expression of X-linked genes (red) and autosomal genes (blue) for males. Plots are shown for all genes on the microarray (All Genes) and subsets containing either genes expressed in both sexes (Co-expressed) or genes expressed in one sex only (sex-specific). P values are from Mann–Whitney U tests comparing expression on the X chromosome versus the autosomes (see Materials and Methods). (B) As in (A) but for females. Numbers above chromosome labels indicate the number of genes.

