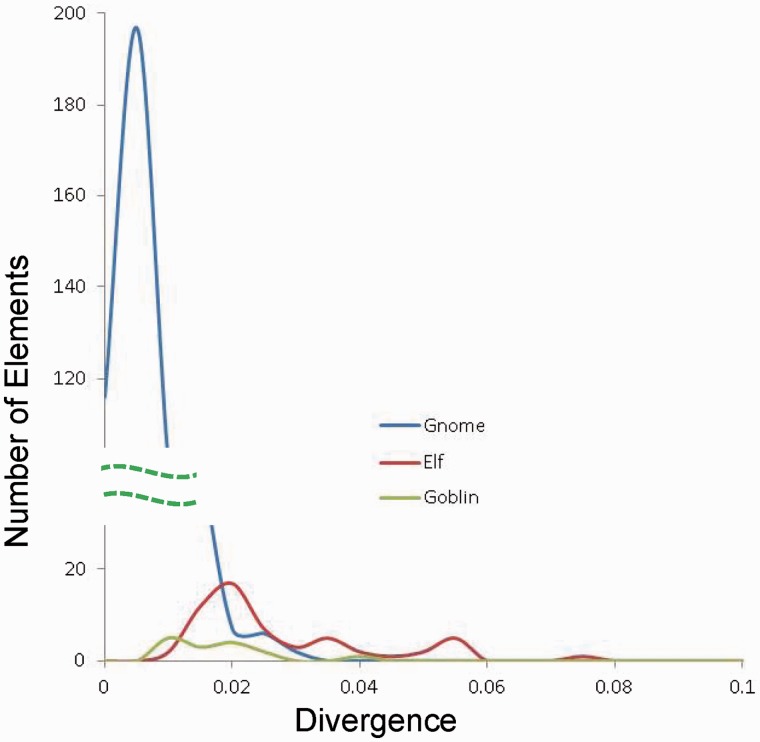
Fig. 5.—
Distribution of sequence divergence for Gnome, Elf, and Goblin families. The numbers of elements in a certain range of divergence from the consensus sequences are plotted against the divergence range. Bin size, 0.005. Dashed lines, broken y axis for better view of the three families. x axis, divergence value; y axis, number of elements in a certain range of divergence value.

