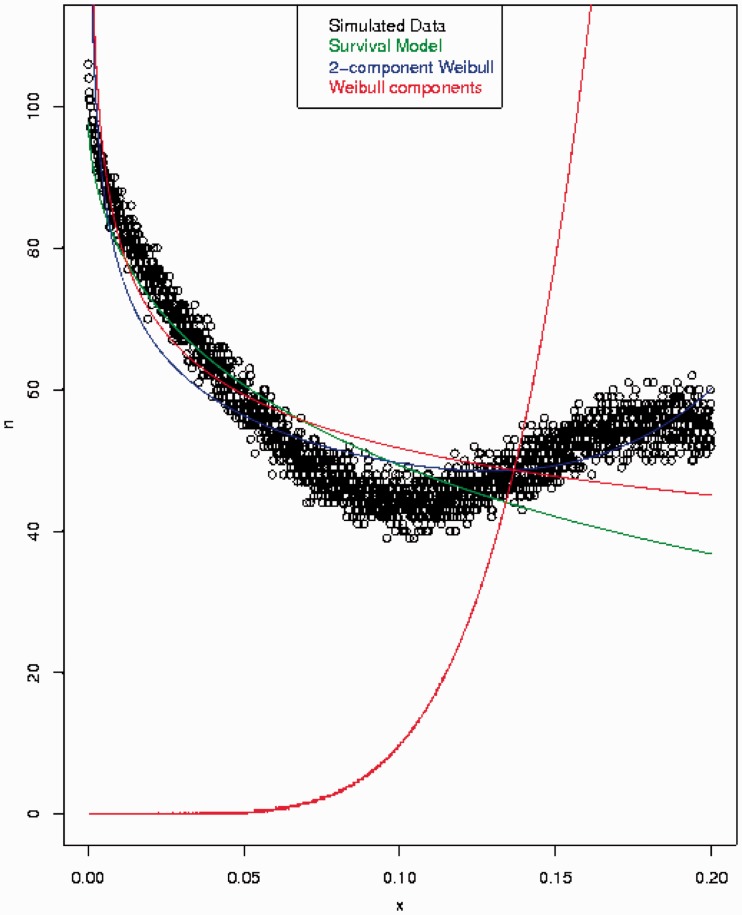
Fig. 4.—
Using the birth process in equation (5) and the death process in equation (6) (green curve), a survival function is simulated (black curve). This is fit statistically with a mixture of two Weibull distributions (blue curve), where the individual components are shown in red. Neither recovers the Weibull loss process of the green curve, with the decaying Weibull function following the data (black) more closely than the green generative process.

