
Figure 1.
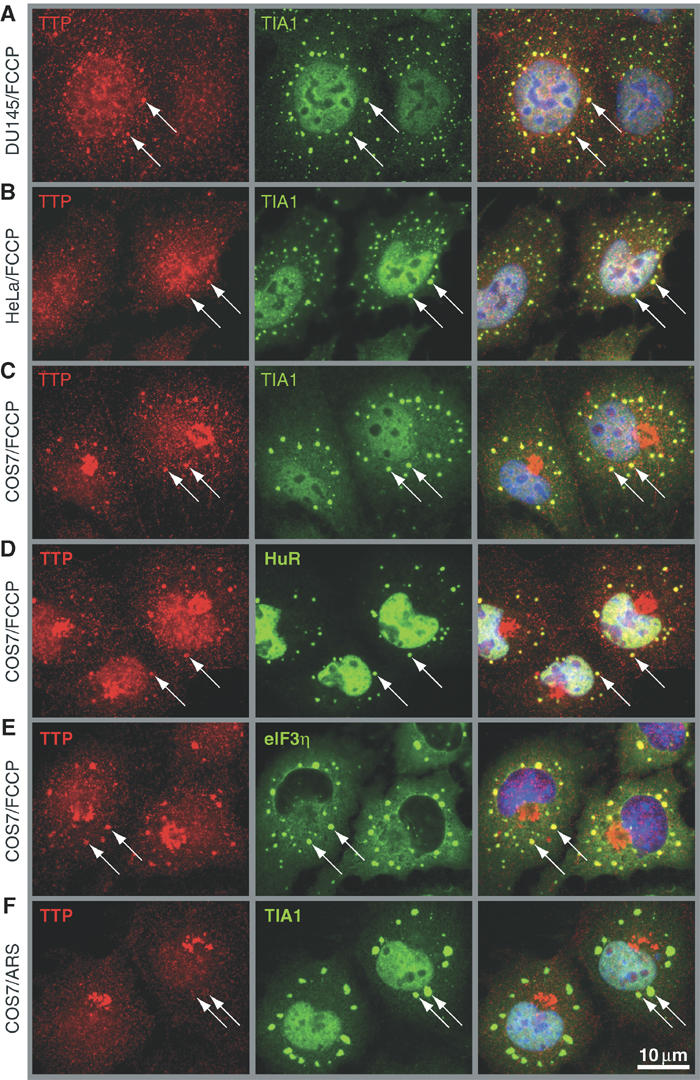
TTP is recruited to SGs upon energy starvation. Subcellular localization of TTP was determined by dual label immunofluorescence using CARP-3, an affinity-purified antibody reactive with TTP (left panels; red), in (A) DU145, (B) HeLa and (C–E) COS7 cells treated for 90 min with FCCP (1 μM). (F) COS7 cells were exposed to oxidative stress by treatment for 60 min with arsenite (ARS, 0.5 mM). SGs were visualized by counterstaining for TIA-1, HuR and eIF3η, as indicated (center panels; green). Merged views are shown in the right panels. Arrows point out SGs; size bar is 10 μm.